- REVIEWS
Displays Electronics 
Speakers Sources Other Gear Software - HOW TO
How To Buy How To Use Tech 101
Sony Bravia XBR-84X900 3D LCD Ultra HDTV HT Lab Measures
The measurements below were taken in the Cinema 1 Picture Mode, through an HDMI input, and in 2D unless otherwise noted.
With the Backlight on 2, the Picture (Contrast) control at 90, the Brightness at 53 (as measured here; later reduced to 51), the Gamma on 0, and the LED Dynamic Control on Standard, the peak white level was just over 37 foot-lamberts. Since the LEDs turned (nearly) full off with the full black field used for the black measurement, the black level as seen by our Minolta LS-100 light meter was 0.001 ft-L—essentially unmeasurable with precision since this is the lowest level the meter will read. But you’ll definitely want to use LED Dynamic Control. With the latter off, the black level increased to 0.043 ft-L for a full-on/full-off contrast ratio of 865:1. The dynamic control is likely this aggressive because IPS panels sacrifice good native contrast for broad off-axis performance, which may be why most manufacturers don’t use IPS panels. But in the limited viewing time possible for this test, I never saw any obvious brightness pumping with LED Dynamic Control on Standard.
All of the color results and charts provided here, together with additional data, were obtained using SpectraCal CalMAN, SpectraCal.com
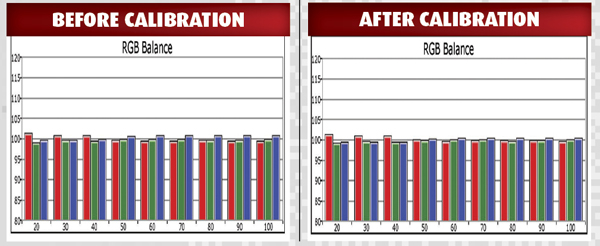
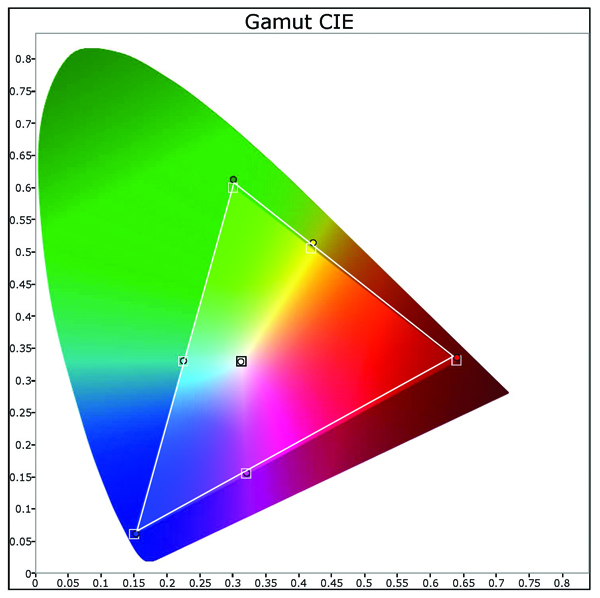
Delta E is a figure of merit indicating how close the color comes to the D65 HD color standard. Values below 3 are generally considered visually indistinguishable from ideal. Pre-calibration, the set’s gray scale Delta E averaged an impressive 0.81, with a high of 1.43 at 100 percent. The pre-calibration 2D color point Delta E averaged 5.45, with red and green the major offenders at nearly 7. It was hardly worth the trouble to do a gray scale calibration, but I did one anyway with the average Delta E dropping to 0.35. While the set has no color management system, I was able to improve the color Delta E to 1.91 with creative tweaking of the Color control, since the major pre-cal color gamut offender was the brightness of the colors, not their locations on the CIE chart. The latter are shown in the accompanying diagram.
The 2D gamma averaged 2.36 in the 0 setting of the gamma control. The maximum was a rather high 2.62 at 70 percent brightness, decreasing to 2.29 at 20 percent and 2.22 at 100 percent, though this odd curve (with LED Dynamic Control on Standard) produced no obvious picture degradation. With LED Dynamic Control off, the gamma averaged just under 2.2 and was consistent across the brightness range (2.12 minimum at 20 percent and 2.21 maximum at 90 percent).
A 3D calibration (diagrams not shown) required considerably more adjustment but was relatively straightforward. The gray scale Delta E pre-calibration average was 9.00. Post calibration, the average was 0.64, with a maximum of 1.08 at 100 percent brightness. The color Delta E averaged 6.19 before and 3.57 after. With the gamma control on 0, the 3D gamma averaged 2.0, with a minimum of 1.82 at 30 percent and a maximum of 2.05 at 80 percent.—TJN
|
| ||||||||||


| Displays Electronics Speakers | Sources Other Gear Software | Top Picks of the Year Top Picks | Custom Install How To Buy How To Use |
Tech 101
|
Latest News Features Blogs | Resources Subscriptions |
WHERE TECHNOLOGY BECOMES ENTERTAINMENT
 © 2026 Sound&Vision
AVTech Media Americas Inc., USA
All rights reserved

