- REVIEWS
Displays Electronics 
Speakers Sources Other Gear Software - HOW TO
How To Buy How To Use Tech 101
BenQ W1070 3D DLP Projector HT Labs Measures
Full-On/Full-Off Contrast Ratio: 1,247:1
All the measurements here, unless noted otherwise, were taken in 2D on a 96-inch-wide, 16:9, Stewart StudioTek 130 G3 screen (gain 1.3), with the projector in its Cinema Preset Mode, calibrated and adjusted for the most accurate image. The Lamp Power was on Economic (low), the Gamma set to 2.4, the Contrast at 45, the Brightness at 51, and BrilliantColor was off. All measurements and viewing were done with over 130 hours on the projection lamp.
The BenQ’s full-on/full-off contrast ratio (sometimes referred to as the peak contrast ratio, the sequential contrast ratio, or the dynamic range) is uninspiring relative to most of the recent displays we’ve tested. Note that the above result was from a measured peak white level of 22.44 foot-lamberts and a black level of 0.018 ft-L.
With BrilliantColor on and the other settings the same, the full-on/full-off contrast ratio was 1,550:1 (27.9 ft-L peak white, 0.018 ft-L black). With the lamp switched to Normal (high), the peak white level shot above 40 ft-L—too bright for comfortable viewing on the StudioTek screen but offering a good margin for using a larger and/or a lower gain screen (the latter should also improve the black level, though not dramatically).
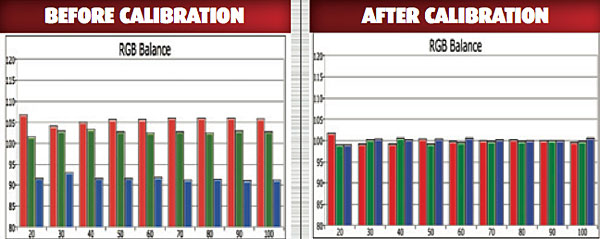
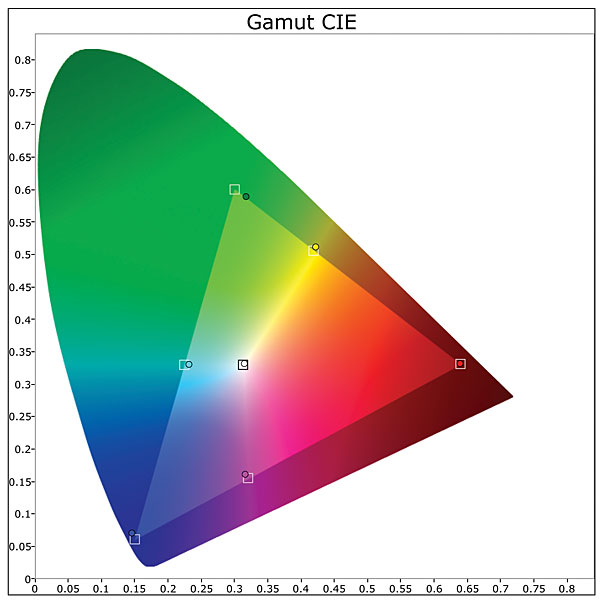
Delta E is a figure of merit that indicates how closely a display adheres to the D65 HD color standard (Rec. 709). Generally, a Delta E under 3.0 (some experts say 4.0) indicates a deviation from ideal that is imperceptible to the eye. The RGB Color Balance charts show graphically how well the BenQ adheres to this standard; the closer the magnitudes of the three primary colors match, the nearer the result is to D65. The pre-calibration result looked better visually than it measured, with an average gray scale Delta E of 6.31 (1.94 at 20 percent brightness, increasing to 10.6 at 100 percent). Post-calibration, the gray scale Delta E averaged 0.36 and never rose above 0.73. The color gamut Delta E averaged 1.74 (a high of 4.07 in blue). At a gamma setting of 2.4, the measured average gamma was 2.31, with a low of 2.23 and a high of 2.35.
At a Gamma setting of 2.4, the 2D gamma averaged 2.31 (minimum 2.23, maximum 2.35).
A calibration performed in the 3D mode produced less impressive results (graphs not shown). Before calibration, the average gray scale Delta E was 19.46, with a high of 32.41 at 100 percent brightness. After, the result was better, though still less than sterling: The average gray scale Delta E was 4.86, but it did remain under 2.77 up to 80 percent brightness, increasing from there to 24.8 at 100 percent. The 3D color gamut Delta E, post calibration, averaged 7.49, and the gamma, at a setting of 2.4, averaged 2.04 (high 2.26 at 20 percent, low 1.71 at 90 percent). At a Contrast setting of 65, the peak white level in 3D on the test screen was 4.44 ft-L.—TJN


| Displays Electronics Speakers | Sources Other Gear Software | Top Picks of the Year Top Picks | Custom Install How To Buy How To Use |
Tech 101
|
Latest News Features Blogs | Resources Subscriptions |
WHERE TECHNOLOGY BECOMES ENTERTAINMENT
 © 2026 Sound&Vision
AVTech Media Americas Inc., USA
All rights reserved

