- REVIEWS
Displays Electronics 
Speakers Sources Other Gear Software - HOW TO
How To Buy How To Use Tech 101
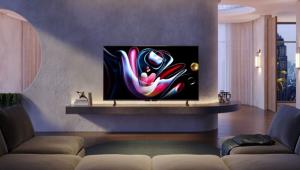
LG G3 OLED Evo 4K TV Review Test Bench
The measurements were made using CalMAN measurement software from Portrait Displays, together with X-Rite i1Pro3 Plus and Klein's K-10A color meters and a Fresco 6-G pattern generator from Murideo.
SDR/HD
Full-On/Full-Off Contrast Ratio: 301,270:1
In the Filmmaker Picture Mode, I began with the OLED Pixel Brightness at 80, Adjust Contrast at 90, Auto Dynamic Contrast and Peak Brightness Off, Gamma at BT.1886, and Black Level at 50. In these settings, the peak white level was 360 nits. I did some of my viewing at this setting, but later dropped down to 301.27 nits, the level used in the contrast ratio shown above. The black level there was 0.001 nits. The measured SDR results differed little, apart from peak brightness, in OLED Pixel Brightness settings from 50 to 80.
At the higher 360 nits output level, the calibrated White Balance (grayscale) Delta E values ranged from a high of 1.06 at 30% to a low of 0.310 at 70%. The individual colors (adjustable in the Color Fine Tune menu, though such adjustments in SDR weren’t needed here) ranged from a low of 0.393 in red to a high of 1.58 in yellow. (A Delta E below 3.0 is generally regarded as indistinguishable from perfect by the human eye.)
A Rec.709 Saturation Sweep, analyzing all primary and secondary colors at saturation levels from 20% to 100%, produced excellent results. The G3 had excellent uniformity on a full field white pattern, with no obvious sign of the “dirty screen effect.”
.JPG)
.JPG)
HDR10
Full-On/Full-Off Contrast Ratio: 1,517,778:1
In the HDR10 Filmmaker Picture Mode, with OLED Peak Brightness at 100, Adjust Contrast at 100, Screen Brightness at 50, Auto Dynamic Contrast Off, HDR Tone Mapping On, and Peak Brightness set to High, the peak brightness measured 1366 nits and the black level 0.0009 nits. Our sample of last year's G2, under roughly the same conditions, produced 925 nits. The year before, our G1 measured 744 nits. That means that in two years LG's G-series OLED has achieved a remarkable peak brightness increase.
It also means that with HDR sources peaking at 1000 nits, no Tone Mapping will be needed. With material mastered at higher levels (there's no industry program source standard for peak HDR brightness) the tone mapping needed will be far less than in the past. (The best LCD displays can still outperform the G3 OLED in peak brightness, but their advantage is now far less than it was two years ago).
Before calibration, the grayscale Delta E's ranged from 0.5 at 40% and 50% to a high of 1.8 at 70%. After calibration the low was immeasurable at 20% (next lowest 0.4 at 50%) and the high 1.3 at 30%. The pre-calibration color Delta E (at 50% stimulation) was a low of 0.4 in green and a high of 2.4 in cyan. After calibration the low was 0.3 in green and the high was 2.4 in cyan (no other color was over 1.4).
In truth the before and after results for both white balance and color differed slightly from one run of measurements to another, but the differences were so small that they might well have been due to drift.
The peak white level at varying on-screen window sizes measured 1400 nits from 1% to 19%, 600 nits at 25%, 400 nits at 50%, and 200 nits at 100% (full field white). A color checker test of a wide range of colors measured 2.2 maximum and 0.95 with luminance included, 0.8 average and 1.98 maximum without luminance.
The saturation sweeps, showing how accurately each color follows the requirements from low brightness to maximum brightness, ranged from very good to excellent—better, in fact than I've ever experienced in the past. The G3 also covered 93.5% of REC.2020 color and 97.5% of P3 (all of the 4K consumer sources we're aware of are P3).
.JPG)
.JPG)
|
| |||||||||


| Displays Electronics Speakers | Sources Other Gear Software | Top Picks of the Year Top Picks | Custom Install How To Buy How To Use |
Tech 101
|
Latest News Features Blogs | Resources Subscriptions |
WHERE TECHNOLOGY BECOMES ENTERTAINMENT
 © 2025 Sound&Vision
AVTech Media Americas Inc., USA
All rights reserved

