- REVIEWS
Displays Electronics 
Speakers Sources Other Gear Software - HOW TO
How To Buy How To Use Tech 101
An Eye for Color: Physics & Physiology Page 2
Most light sources emit many wavelengths at various intensities simultaneously; this is called the spectral distribution of the source. The graph of a light source's intensity vs. wavelength is called the spectral curve (see Fig.2). To take the spectral distribution of a light source into account, radiant flux is sometimes measured in units of watts per nanometer (W/nm) to indicate the amount of power being emitted at each wavelength.

Fig.2: The spectral curve of the sun indicates that many wavelengths of visible light are present. The wavelengths of highest intensity are in the 500nm range.
Physiology
As light enters the eye, it is focused by the cornea and lens and strikes the retina at the back of the eye (see Fig.3). The retina includes two types of cells that are stimulated by visible light: rods and cones. Information from the rods and cones is sent to the brain via the optic nerve.
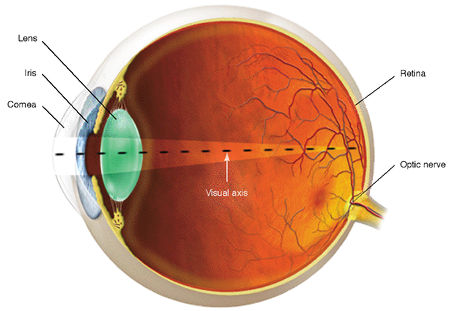
Fig.3: Light enters the eye through the cornea and is focused by the lens on the retina, at the back of the eyeball.
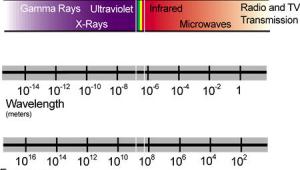
This gives rise to the perception of color based on the wavelength of light, just as the frequency of audible sound gives rise to the perception of pitch. Humans can perceive 10 octaves of sound frequencies, from 20Hz to 20kHz. However, we can perceive less than one octave of light frequencies, from 3.9x10⁸MHz (red) to 7.5x10⁸MHz (violet). As mentioned earlier, these correspond to wavelengths of 400nm (violet) to 770nm (red), which are typically used to identify different frequencies of light.
Our visual system adopts one of two states, depending on the ambient lighting conditions. Dark-adapted (night) vision is called scotopic, and is ruled by the rods. Scotopic vision is most active in the short wavelengths, which is why things appear blue in the dark. On the other hand, light-adapted (daylight) vision is called photopic, in which the cones dominate. The cones are not as sensitive to intensity as the rods, but they respond to all visible wavelengths, which gives rise to our perception of color.
Photopic vision kicks in when the ambient luminance is about 1fL or more. Below about 0.1fL, scotopic vision takes over. In the region between 1 and 0.1fL, both types of vision are used simultaneously, which is called mesopic vision.
The human response to different visible wavelengths is not constant across the entire perceptible range. This is analogous to sound—the human auditory system is most sensitive to frequencies in the 1–5kHz range. Frequencies outside this range must have greater intensity than those within this range in order to be perceived as equally loud.
Similarly, the perceptive response to light is not constant. The responses of many subjects to color-matching tests have been averaged to produce internationally accepted sensitivity curves for scotopic and photopic vision (see Fig.4), which play an important role in video calibration and intensity measurements. For example, the photopic curve is used to weight the measurement of luminous flux, as discussed previously.

Fig.4: Dark-adapted (scotopic) vision is sensitive to shorter wavelengths, while light-adapted (photopic) vision is sensitive to all visible wavelengths, although not equally.
Also, notice where the two curves in Fig.4 intersect: at 555nm, selected as the official reference for defining the candela because this is the wavelength at which scotopic and photopic vision exhibit roughly equal sensitivities. In addition, 555nm is at the peak of the photopic curve, which means that daylight vision is most sensitive to this wavelength.
The cones include pigments that absorb light energy in different ranges of wavelengths. There are three types of pigments, called R, G, and B, and each cone includes only one type. This might lead you to believe that the cones absorb red, green, or blue light, respectively, which is true to some extent. However, the sensitivity ranges of each type overlap significantly (see Fig.5). The R cones are most sensitive to 570nm, while the G cones are most sensitive to 540nm. The B cones are most sensitive to 440nm, and they are not appreciably stimulated by wavelengths above 540nm. The three types of cones provide a physiological basis for trichromatic color reproduction (which I'll explain shortly).
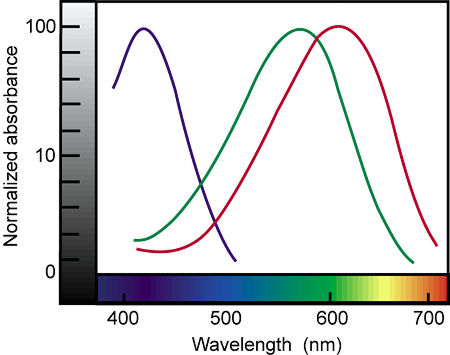
Fig.5: The sensitivities of the R, G, and B cones overlap to let us perceive all visible wavelengths.
Luminous intensity gives rise to the perception of brightness, just as sound intensity gives rise to the perception of loudness. The difference in intensity between the softest perceivable sound and the loudest sound that can be tolerated without pain is a ratio of 109:1. This is called the dynamic range. For light, the maximum dynamic range is about 108:1 between the lowest perceptible light intensity and the highest intensity we can tolerate without glare.
Interestingly, the eye's practical dynamic range is much less than this maximum ratio—about 104:1. The practical range shifts up and down within the larger maximum range depending on the overall amount of light entering the eye at any given moment. If the amount of light entering the eye is high, the practical range moves upward toward the top of the maximum range; if the amount of light is low, the practical range drops toward the bottom of the maximum range. This occurs because of the action of the iris (which automatically opens and closes depending on the amount of light entering the eye) and certain chemical reactions in the retina. In addition, the eye is most sensitive to a dynamic range of about 100:1 in the middle of the practical range, with much less sensitivity to changes in intensity outside this range.
As the photopic curve illustrates, our perception of brightness depends in part on wavelength. For example, suppose you have two light sources that emit the same radiant flux (say, 1W). The wavelength emitted by one source is 555nm (the wavelength of highest photopic sensitivity), while the other source emits some other wavelength. The source at 555nm will appear brighter than the other source, even though they are radiating the same power.
Another important aspect of our perceptive response to light is the relationship between intensity and perceived brightness. If you look at a brightness-ramp test pattern, which is black at one end and changes smoothly to white at the other end (see Fig.6), the halfway point between black and white looks about 50% gray, as you would expect. However, the intensity required to produce that 50% gray is only about 18% of the intensity that produces the sensation of full white. This illustrates that our perception of brightness is not linear, but logarithmic, which is critical when it comes to capturing and displaying video images, as we will see in Part 2 of this article.
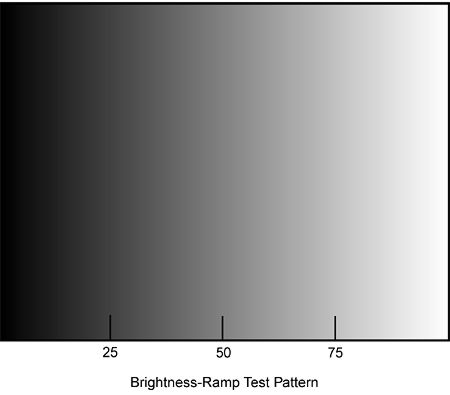
Fig.6: The halfway point between black and white in this brightness-ramp test pattern appears to be 50% gray, but to produce this level of brightness requires only 18% of the intensity of full white.
Color Temperature
We see an object when light from that object enters our eyes. The light can be reflected by the object from another source, or the object might radiate its own light. Examples of objects that radiate light include stars, CRTs, and light-bulb filaments.
Some objects that radiate their own light are hot; this is called incandescence. For example, a cold iron bar can only reflect light from another source. However, if you heat the bar sufficiently, it begins to radiate light of its own. At about 3000°C, it glows red and is said to be "red hot." At about 6000°C, it glows white and is said to be "white hot." In fact, such a heated iron bar radiates many wavelengths of light at different intensities. In other words, it exhibits a spectral curve, which changes according to the temperature of the bar.
In the 19th century, scientists studied this phenomenon with great interest. During this investigation (which eventually led to the development of quantum physics), they introduced the concept of a blackbody —a theoretical object that absorbs all radiant energy incident upon it and reflects no energy at all. Of course, a true blackbody doesn't exist in nature, although coal comes pretty close. When viewed from the outside, a small hole in the wall of an otherwise enclosed, large cavity (such as a furnace) is even closer to an idealized blackbody.


| Displays Electronics Speakers | Sources Other Gear Software | Top Picks of the Year Top Picks | Custom Install How To Buy How To Use |
Tech 101
|
Latest News Features Blogs | Resources Subscriptions |
WHERE TECHNOLOGY BECOMES ENTERTAINMENT
 © 2025 Sound&Vision
AVTech Media Americas Inc., USA
All rights reserved

