Color Points and Kelvins
There’s more that goes into making a good display than accurate color, but it’s certainly one of the biggies. Color in a video display may seem like a relatively simple subject, but it’s not. In this Gear Works, I’ll outline the two most important factors in assessing and measuring the color accuracy of the HDTVs we review—color tracking and color gamut. I’ll also show you how we present this in the HT Labs Measures graphics that accompany our reviews. This article will shed some light on what these important measurements tell us about the color accuracy of the displays we test here at Home Theater.
From Gray Scale to Color Tracking
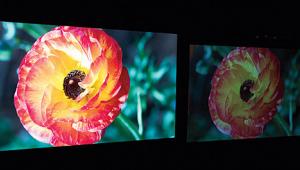
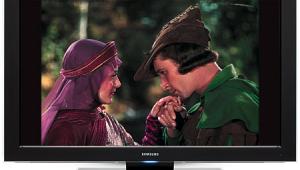
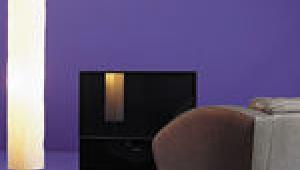
The foundation of accurate color is the color of gray. That may sound odd, but it applies even with color program material. You can think of the range of grays, from near black to peak white (called the gray scale) as a canvas, with all the colors “painted” on top of it. The wrong shade of gray can be obvious in a black-and-white image, where it can be too warm (Figure 1, where the canvas has a rosy tint), too cool (Figure 2, where it’s bluish), or just right (Figure 3, neutral). When the image is in color, you can think of the overlaid colors as translucent. They’re influenced by the tint of the white/gray canvas beneath them. In other words, if the shades of gray in that foundation are wrong, the colors will be wrong as well.
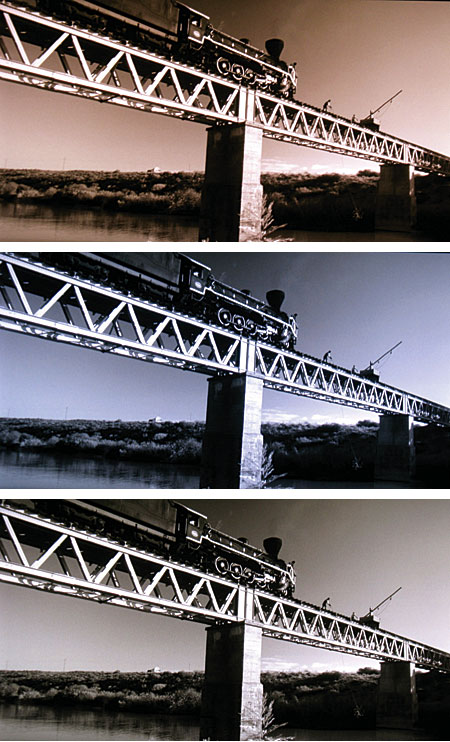
Figures 1, 2, & 3.
A color temperature, specified in degrees Kelvin, represents those all-important grays (and all colors). Color temperature ranges from reddish or too warm (low numbers) to bluish or too cool (high numbers). The current standard for gray in consumer video displays is 6500 degrees Kelvin, or as it’s more commonly called, 6500K.
Some time back, we updated the graphs we present in our reviews to show a display’s color accuracy. In order to explain these new graphs, we first have to go back a year or so to the measurements we used to publish. One of our older charts (Figure 4) is a before-and-after plot of a display’s gray-scale tracking. It shows the color temperature of its grays across the brightness range in degrees Kelvin, from 20 IRE (very dark gray) to 100 IRE (full white). (The brightness range actually starts at black, or 0 IRE, but the range from 0 IRE to 20 IRE is difficult to accurately measure with test tools that are even remotely affordable.)
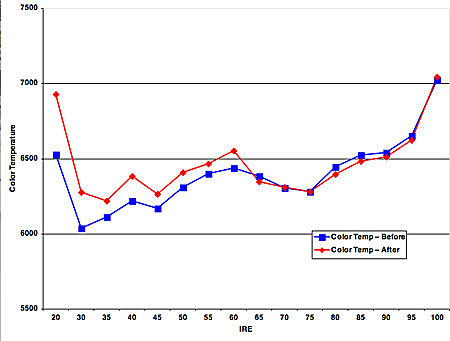
Figure 4
However, the color temperature plot in Figure 4 alone is not sufficient. True, it does provide a rough before-and-after snapshot of the calibration. But just because a display’s gray scale tracks as near as possible to 6500K doesn’t guarantee that the image will be free of unwanted color tint across the brightness range.
The software we’ve been using in the past year or so provides a far more precise picture of a display’s color accuracy. We start by taking the same measurements as before, but our new software creates color tracking charts (Figures 5 and 6) from these measurements. A color tracking chart makes use of the fact that red, green, and blue must be present in the correct proportions to produce the required shade of gray at all levels across the brightness range. At a glance, it shows us whether the display is mixing these colors in the required amounts, how badly it deviates if the mix isn’t correct, and the color or colors that are causing the deviation.
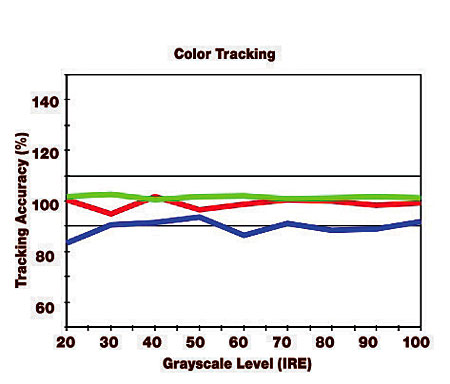
Figure 5
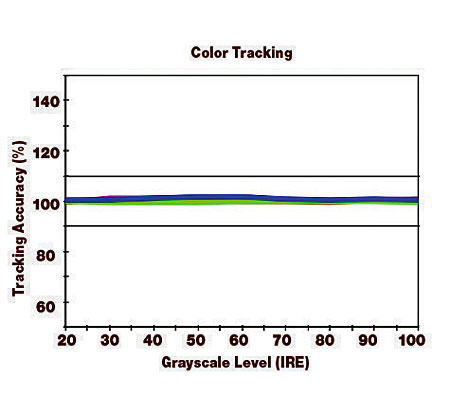
Figure 6
For example, if the display produced the right amount of blue for a mid-brightness gray at around 50 IRE, it would read 100 percent at 50 IRE. The same is true for red and green. Figure 5 is a before-calibration result for color tracking in a real display, using the new chart. In this case, while red and green are close to being correct, there is less blue across the brightness range than the display needs to produce the required shades of gray.


