- REVIEWS
Displays Electronics 
Speakers Sources Other Gear Software - HOW TO
How To Buy How To Use Tech 101
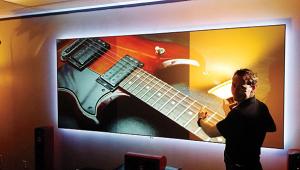
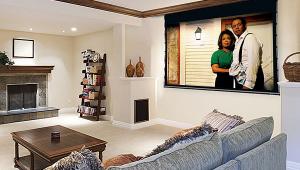
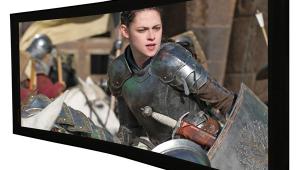
Stewart Filmscreen Reflections Active 170 3D & Da-Lite High Power Projection Screens HT Labs Measures
There are innumerable ways you can measure a screen. To compare how the brightness varied in each of the candidates at different off-axis angles and viewing positions, I took five different types of readings with our Minolta LS-100 light meter. The projector, a JVC DLA-X70R, was not moved during the tests, and the only changes made from screen to screen in a given set of measurements were, in some cases, very slight alterations in lens zoom and shift. Some of the measurements were also affected slightly by differences in screen size, but that will have little effect on the applicability of the results (the Da-Lite was about 8 percent smaller than the Stewart by area). The throw distances from screen to projector ranged from about 13 to 14 feet.
Keen readers will note that some of the readings you will see in the “Sony VPL-VW1000: Take 2” review in this issue vary a bit from what you see here. In that review, the throw distances from projector to screen were longer (about 16 feet for the Sony and 19 feet for the other projectors mentioned ). This will affect the readings (the closer the projector with a zoom lens is to the screen for a given screen size, the brighter the image and the lower the contrast will be).
Measurements taken in different areas of the screen will invariably include deviations inherent in the projector. The absolute values measured here would be different with a different projector, but the general trends should be the same.
As a frame of reference, all of the measurements were repeated on a Stewart Filmscreen StudioTek 130 G3, a widely popular home theater material with a rated gain of 1.3 and an off-axis viewing angle of 68 degrees. The images measured on the StudioTek 130 were 96 inches wide for comparable results (but the full StudioTek screen is larger).
For clarity, most of the results here have been normalized as percentages rather than as raw data in foot-lamberts. The percentages were rounded off to the nearest whole number.
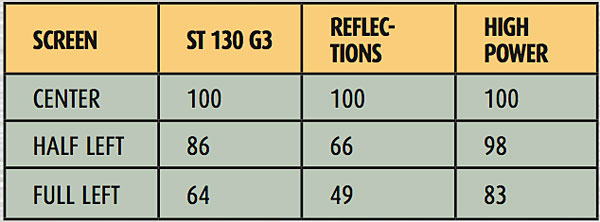
Test A: on-axis screen brightness
This test shows how uniform the screen brightness will be for a viewer sitting on-axis. The meter was positioned directly behind the projector. The brightness was then measured at three locations: center screen, halfway between the center and the left side, and the far-left side. High gain does not come free, but the surprise here is how little the brightness falls off on the High Power at the edges. This is consistent with its lack of a clearly visible hotspot.
Test B: off-axis screen brightness
This test is designed to show what a viewer sitting off-axis will experience. All measurements here were taken off the center point of the screen, but the readings were taken with the meter positioned at four locations: on-axis and at three different off-axis angles. This is the measurement manufacturers use to specify the half-brightness viewing angle of a screen. To calculate the expected off-axis brightness, multiply the center brightness by the percentage shown. For example, for 20 ft-L experienced when seated in the center, you should expect to see just 8 ft-L on the High Power when moving 20 degrees off-axis.

Test C: 20 degrees off-axis screen brightness
This test shows what brightness a viewer seated 20 degrees off-axis will experience across the screen from left to right. The meter was positioned 20 degrees to the left of center for all of the measurements. Readings were taken at center screen, half left, full left, half right, and full right. The results here are a little difficult to interpret, but the higher brightness at the half-left position is likely due to that position being closer to the meter, positioned 20 degrees off-axis. The surprising brightness uniformity of the High Power across the screen is again evident.
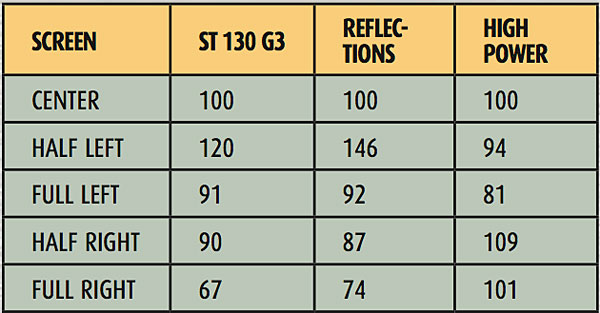
(Due to the logistics of the 92- and 96-inch screen sizes, the full-right High Power reading was taken slightly short of the far right side of that screen.)
Test D: Light retention, center to corners
This test shows how bright the image is in the corners relative to the center.

(Due to the logistics of the 92- and 96-inch screen sizes, the High Power corner reading was taken only in the upper-left-hand corner; the readings on the other screens are an average of all four corners.)
Test E: 3D brightness
This is the only test involving 3D (the other results shown above were all performed in 2D), but it clearly shows the issues involved in producing adequate brightness from 3D. In this case, the image was set to 92 inches wide on all of the screens. For the 2D tests, the JVC’s projection lamp was set on High, the iris fully opened, the Contrast setting on 7, and a User picture mode selected. For the 3D results, the conditions were the same, except the Contrast was set to 10 and the Picture mode to 3D. Unlike the above tests, the readings here are shown in ft-L (to the nearest half ft-L) rather than as percentages. The 3D Loss line shows the percent decrease in brightness going from a 2D source to 3D.

Off-Axis Color
For color, we didn’t conduct measurements as exhaustive (and exhausting) as we did for brightness. But we did check to see how the color shifted for a viewer seated in the center versus a viewer sitting 20 degrees off-axis. The JVC was first calibrated, as is normally done, on-axis at the center of each screen. (Each screen was calibrated separately; a good calibration on one screen will not generally be transportable to another screen). In each case, the resulting overall calibrated grayscale Delta E, from the centered meter position where the calibration was performed, was under 1.0, with no reading at any brightness level above 2.1 for any of the screens. Therefore, the on-axis calibration results are not shown here. (Delta E is a measure of deviation from the grayscale and color standards, with a value of 3.0 or in each case less generally considered to be imperceptible.)
But the 20-degree, off-axis results are shown. The projector was not recalibrated for this result; the purpose here was to show how moving off-axis alters the result of the calibration. The StudioTek 130 is the consistent champ here, and although the chart doesn’t look as pretty as the on-axis results (not shown), the overall Delta E was 1.52, with no individual Delta E going above 2.76. The Reflections chart shows the issues that begin to arise when you shoot for higher gain. We’re fighting the laws of physics here. The average grayscale Delta E of the Reflections was 4.9, but it rises above the 60 percent brightness level and tops out at 7.98 at 90 percent.
The High Power’s high gain doesn’t do it any favors on color, either. Its average, off-axis, grayscale Delta E was 7.69. While it was respectable below 50 percent brightness, it increased gradually after that until it topped out at 12.9 at 90 percent.

These measured color shifts from the on-axis results look grim on paper, but in fact the eye compensates, and the average viewer isn’t likely to see anything amiss. One interesting possibility here that we didn’t try would be to calibrate the projector at about 10 degrees off-axis. Assuming the projector and screen are left-right symmetrical, which they should be, that should produce a reasonably wide and accurate primary viewing cone of +/- 20 degrees. Something to ponder, in any case.
The shift in the color gamut, not shown here and a different issue than the grayscale’s discussed above, was inconsequential—a maximum change in overall color Delta E of a hair over 1.0 for both the Reflections and High Power, and barely measurable for the StudioTek 130.
|
| |||||||||


| Displays Electronics Speakers | Sources Other Gear Software | Top Picks of the Year Top Picks | Custom Install How To Buy How To Use |
Tech 101
|
Latest News Features Blogs | Resources Subscriptions |
WHERE TECHNOLOGY BECOMES ENTERTAINMENT
 © 2026 Sound&Vision
AVTech Media Americas Inc., USA
All rights reserved

