- REVIEWS
Displays Electronics 
Speakers Sources Other Gear Software - HOW TO
How To Buy How To Use Tech 101
Epson PowerLite Pro Cinema 1080p Measurements
With Output Scaling set to 100% there was no significant Overscan at any input resolution I tested using HDMI or component- 480i/p, 720p and 1080i. I saw no obvious geometry errors either, but a white crosshatch on a black background revealed a slightly fuzzy and indistinct pixel structure and some color fringing around one pixel in width over broad sections of the right and left of the screen. Whether these were due to chip alignment issues or chromatic aberration in the lenses, this is entirely consistent with the projector's soft look, as is the frequency response you'll read about below.
I looked at test signals over HDMI at 1080i from my Accupel signal generator and 1080p from a Spears and Munsil test disc played on the Toshiba HD-XA2. The highest luma frequencies at 1080i/p were noticeably soft with very faint lines. 720p from the Accupel was better but still soft and even the high frequencies at 480i/p looked just a little rolled off.
Using the chroma bursts from the Spears and Munsil disc from the Toshiba player showed fine response to the limits. The chroma response with the Accupel generator, which is an RGB source driven from a DVI output using a DVI-HDMI breakout cable, was weirder though. At the highest frequencies at 720p and 1080i lines that were supposed to be alternating vertical red/magenta and blue/yellow crushed into swatches of single colors. This might indicate some issues if you plan on using a DVI/RGB source.
With component the luma response was the same- noticeably soft at 720p and 1080i- but the chroma response, while also soft, didn't exhibit the color smearing I saw over HDMI.
Measurement Addendum
All of the measurements below were performed with the iris On, in the HD mode, and with the lamp on Low. The High lamp setting increased the peak white level by about 20%.
The accuracy of the primary and secondary color points of the Epson, out of the box, was typical of most modern digital projectors. That is, apart from green, which was significantly off, they were good but not exceptional.
However, adjustments provided by the projector do allow you to shift the color points. This must be done with a precision test tool such as our Photo Research PR-650 spectroradiometer. The procedure is tedious. I judged the magenta and yellow secondaries close enough to the standard to leave as is. Cyan resisted significant change, but was off (by about 10%) only in the x coordinate. The primaries, however, were as close to accurate, post adjustment, as I have yet measured, with green virtually spot-on. For the more technically inclined, here are the numbers for the primaries:
| x | y | |
| HD Standard (red) | 0.64 | 0.33 |
| Pre-calibration | 0.667 | 0.329 |
| Post calibration | 0.644 | 0.332 |
| HD Standard (green) | 0.30 | 0.60 |
| Pre-calibration | 0.266 | 0.663 |
| Post calibration | 0.303 | 0.603 |
| HD Standard (blue) | 0.15 | 0.06 |
| Pre-calibration | 0.148 | 0.049 |
| Post calibration | 0.15 | 0.064 |
As shown in the chart, the 6500K color temperature setting on our sample of the Epson resulted in color temperature numbers very close to that value. But those values had a slight excess of green, particularly above 50IRE. That is, they were close to 6500K, but displaced from the desired D6500 target point. After calibration, each reading was much closer to the standard D6500, even though the Before and After Kelvin color temperatures appear to show little improvement.
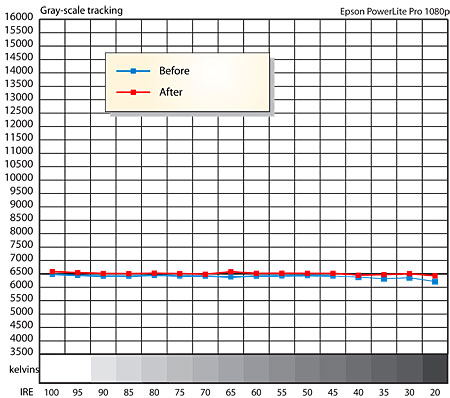
(Remember that 6500K is a lineon the color chart; there are an infinite number of points on that line where we can obtain readings of 6500K. Only one of these points, by convention called D6500, or sometimes simply D65, is the precise point we are usually aiming for when we perform a calibration.)
I measured a peak contrast ratio, iris On, of 4,876:1. The peak white from the projector, on a 78-inch wide, 16:9, 1.3-gain Stewart Studiotek 130 projection screen, iris On, measured 10.47 foot-Lamberts. The video black under the same conditions, iris On, measured 0.002fL.
If you run the latter two numbers, they would appear to indicate a peak contrast ratio of 5,235:1. That's because the 10.47fL/0/002fL numbers were measured on the full screen, while the peak contrast number shown above was measured on a projected image about 18" wide. This smaller image increased both the black and white levels to the point where the black reading, in particular, falls in a more precise region of our Minolta light meter's range. Its minimum rated sensitivity is 0.001fL.
I also measured a modified ANSI contrast ratio on the Epson (measuring just the four center squares) of 230:1. This is in the same ballpark as the modified ANSI contrast measurements I have made on LCD and LCoS digital projectors. DLP projectors, from the limited evidence we've seen so far, produce superior ANSI contrast numbers: I recently measured 494:1 on the BenQ W10000.
As with the peak contrast, the ANSI contrast was also measured using a smaller projected image, with the white squares blocked off as much as possible when measuring the black ones to minimize the effect of room reflections. But keep on mind that the only environment in which to determine a truly definitive ANSI contrast number is a black hole!—TJN
|
| |||||||||


| Displays Electronics Speakers | Sources Other Gear Software | Top Picks of the Year Top Picks | Custom Install How To Buy How To Use |
Tech 101
|
Latest News Features Blogs | Resources Subscriptions |
WHERE TECHNOLOGY BECOMES ENTERTAINMENT
 © 2026 Sound&Vision
AVTech Media Americas Inc., USA
All rights reserved

