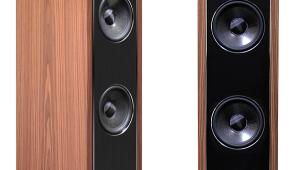
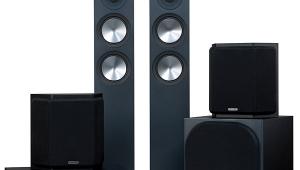
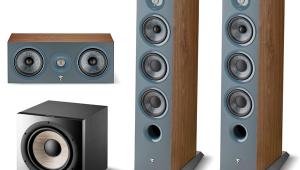
PSB Imagine T Speaker System HT Labs Measures
L/R Sensitivity: 88 dB from 500 Hz to 2 kHz
Center Sensitivity: 87.5 dB from 500 Hz to 2 kHz
Surround Sensitivity: 85 dB from 500 Hz to 2 kHz

This graph shows the quasi-anechoic (employing close-miking of all woofers) frequency response of the Imagine T L/R (purple trace), SubSonic 6i subwoofer (blue trace), Imagine C center channel (green trace), and Imagine S surround (red trace). All passive loudspeakers were measured with grilles at a distance of 1 meter with a 2.83-volt input and scaled for display purposes.
The Imagine T’s listening-window response (a five-point average of axial and +/–15-degree horizontal and vertical responses) measures +1.46/–2.88 decibels from 200 hertz to 10 kilohertz. The –3-dB point is at 52 Hz, and the –6-dB point is at 47 Hz. Impedance reaches a minimum of 5.58 ohms at 224 Hz and a phase angle of –60.14 degrees at 86 Hz.
The Imagine C’s listening-window response measures +1.90/–3.28 dB from 200 Hz to 10 kHz. An average of axial and +/–15-degree horizontal responses measures +2.14/–3.28 dB from 200 Hz to 10 kHz. The –3-dB point is at 70 Hz, and the –6-dB point is at 58 Hz. Impedance reaches a minimum of 5.93 ohms at 186 Hz and a phase angle of –63.34 degrees at 96 Hz.
The Imagine S’s three-face averaged response measures +2.93/–5.76 dB from 200 Hz to 10 kHz. The –3-dB point is at 90 Hz, and the –6-dB point is at 78 Hz. Impedance reaches a minimum of 5.58 ohms at 213 Hz and a phase angle of –59.47 degrees at 114 Hz.
The SubSonic 6i’s close-miked response, normalized to the level at 80 Hz, indicates that the lower –3-dB point is at 25 Hz and the –6-dB point is at 23 Hz. The upper –3-dB point is at 131 Hz with the LFE Input switch set to Active.—MJP
