- REVIEWS
Displays Electronics 
Speakers Sources Other Gear Software - HOW TO
How To Buy How To Use Tech 101
Samsung PN51E550D1F 3D Plasma HDTV HT Labs Measures
Full-On/Full-Off Contrast Ratio: 2,554:1
All the measurements here were taken in the Movie picture mode.
The above 2D full-on/full-off contrast ratio was derived at a measured peak white level of 30.65 foot-lamberts and a full black reading of 0.012 ft-L. The Cell Light was set to 18, the Contrast to 95, the Brightness to 44, and the Gamma to –1.
As noted in the main review, on many full-field black screen images, the screen dropped full off and the black level became unmeasurable. But this was not the case when even a small portion of the screen was illuminated. In that case, the black level increased to the above value, which is the set’s lowest useful black level on real program material in the above settings. Relative to today’s best plasma sets, 0.012 ft-L is not a particularly impressive number, but those sets are considerably more expensive than this one. The blacks also looked subjectively better on most program material than this reading might indicate.
In 2D, the Gamma control’s –1 setting produced measured gammas ranging from a high of 2.26 at 20 percent and 90 percent brightness to a minimum of 2.15 at 70 percent, for an average of 2.21. In 3D, the –2 setting produced gammas ranging from a high of 2.43 at 90 percent brightness and a low of 1.89 at 20 percent, for an average of 2.12.
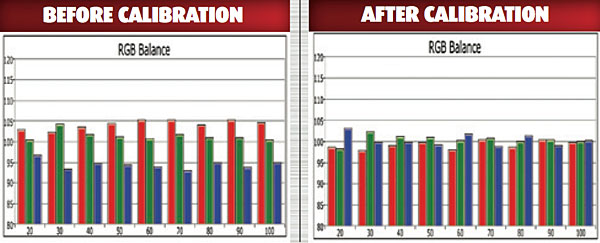
The RGB Balance charts show how well a display adheres to the D65 standard white point; the tighter the match of the three primary colors at each point across the brightness range, the nearer the result is to D65 at that point. The minimum pre-calibration 2D gray-scale Delta E was 0.73 at 20 percent brightness, the maximum 6.88 at 90 percent, and the average 4.32. Post-calibration, the minimum gray-scale Delta E was 0.79 at 20 percent, the maximum 1.32 at 80 percent, and the average 0.95. Delta E is a figure of merit showing how close the result is to the standard D65 white point. Most experts recommend a Delta E of 3.0 or less to produce a visually ideal result, though some loosen this tolerance to 4.0.
Optimizing the 3D white balance was more difficult, and though the result exceeded the above guidelines, it was acceptable. The charts are not shown here, but before calibration, the 3D gray-scale Delta E averaged 6.46. After calibration, the maximum Delta E was 4.69 at 100 percent, the minimum 0.88 at 20 percent, and the average 2.75.
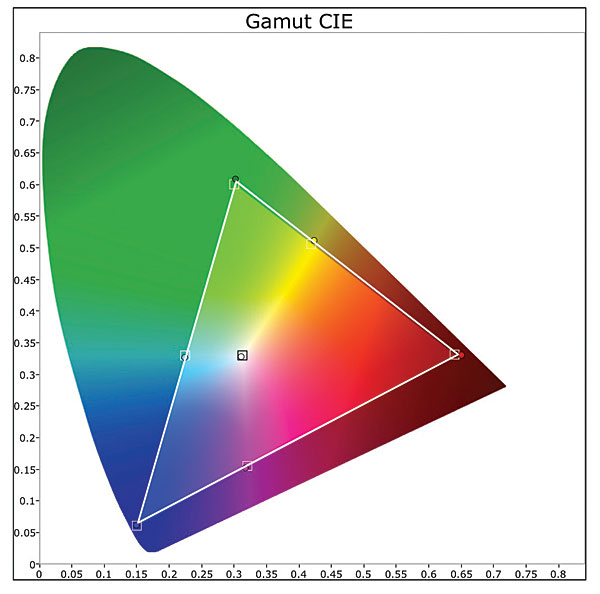
The Gamut CIE chart shown is for 2D, post calibration—though no alterations were possible since there is no CMS (small tweaks in the Color and Tint control do affect the result, but they act on all colors at once so they can only crudely tweak the color gamut). The 2D result closely matches the Rec. 709 standard, and the overall 2D color Delta E averages 1.85 (maximum 3.77 in yellow). For 3D (CIE chart not shown), the results produced an average color Delta E of 8.25, with a maximum of 11.8 in red. Not particularly good, but the 3D color did look reasonably natural.—TJN
|
|
| ||||||||||


| Displays Electronics Speakers | Sources Other Gear Software | Top Picks of the Year Top Picks | Custom Install How To Buy How To Use |
Tech 101
|
Latest News Features Blogs | Resources Subscriptions |
WHERE TECHNOLOGY BECOMES ENTERTAINMENT
 © 2026 Sound&Vision
AVTech Media Americas Inc., USA
All rights reserved

