- REVIEWS
Displays Electronics 
Speakers Sources Other Gear Software - HOW TO
How To Buy How To Use Tech 101
LG 55LM8600 3D LCD HDTV HT Labs Measures
Full-On/Full-Off Contrast Ratio: 28,710:1
All the measurements that follow were made in the Expert 1 picture mode. The above 2D full-on/full-off contrast ratio was obtained with the Backlight at 42, the Contrast at 80, the Brightness at 56, the Gamma at 2.4, and LED Local Dimming on Medium. The peak white level for the above reading was 28.71 foot-lamberts and the black level 0.001 ft-L.
The differences among the High, Medium, and Low settings of the LED Local Dimming control were significant. Though no control settings were changed for these measurements, the Medium setting of the LED Local Dimming control was the only one with a measured peak white level under 30 ft-L. In High (the setting used for the viewing tests), the black level was unmeasurable. In Low, the black level increased to 0.005 ft-L, and the peak white level was 33.62 ft-L, for a full-on/full-off contrast ratio of 6,724:1. With LED Local Dimming off, the peak white level was 34.57 ft-L, the black level 0.036 ft-L, and the full-on/full-off contrast ratio 960:1. You’ll definitely want to use LED Local Dimming.

Color-tracking charts were generated in SpectraCal CalMAN, www.SpectraCal.com
All of the 2D and 3D calibrations here were performed using only the two-point White Balance controls. The improvements including the 20-point adjustments were judged minor in our sample. The pre-calibration color tracking results measured their best in the Medium Color Temperature setting, with a minimum white balance Delta E of 2.34 at 20 percent brightness, a high of 7.95 at 100 percent, and an average of 5.56. Post-calibration, adjusted using the Warm Color Temperature setting, the only values above 1.0 were 1.38 at 90 percent and 1.48 at 100 percent, with an average of 0.55. (Delta E is a figure of merit that indicates how close the result is to the BT709, otherwise known as Rec. 709, HD standard. A Delta E below 3 is generally considered excellent and visually indistinguishable from perfect.)
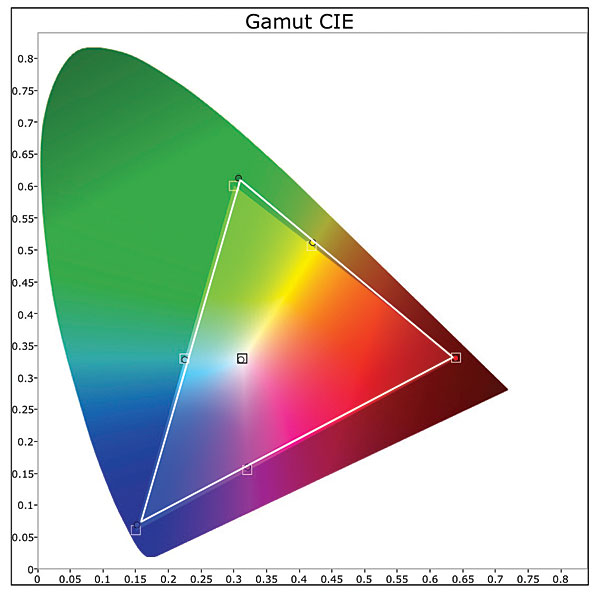
The pre-calibration 2D color gamut (not shown) was satisfactory, with an average color Delta E of 4.17 and a maximum of 6.17 (green). While several of the CMS controls appeared to have little positive effect, there were enough that did to achieve a post-calibration average of 1.1 with a peak of 2.48 (blue). The 2D post- calibration CIE chart is shown.
In 3D (charts not shown), the pre-calibration color was fair but could be significantly improved by calibration. The white balance Delta E was 6.42 before and 0.64 after. The 3D color gamut Delta E was similarly improved by calibration, from an average of 4.95 before to 1.68 after.
At a 2.4 Gamma control setting, the 2D gamma averaged 2.22, with a minimum value of 2.12 at 20 percent brightness and a maximum of 2.38 at 80 percent.—TJN


| Displays Electronics Speakers | Sources Other Gear Software | Top Picks of the Year Top Picks | Custom Install How To Buy How To Use |
Tech 101
|
Latest News Features Blogs | Resources Subscriptions |
WHERE TECHNOLOGY BECOMES ENTERTAINMENT
 © 2026 Sound&Vision
AVTech Media Americas Inc., USA
All rights reserved

