- REVIEWS
Displays Electronics 
Speakers Sources Other Gear Software - HOW TO
How To Buy How To Use Tech 101
Fujitsu Plasmavision SlimScreen P50XHA10U high-definition plasma display Calibration
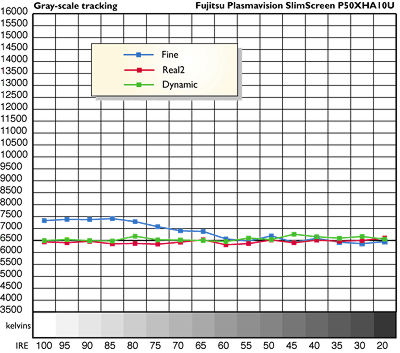
Prior to calibration, the Fujitsu Plasmavision SlimScreen P50XHA10U's Standard color-temperature setting, in the Fine picture mode, produced a color temperature of 10,500 kelvins at 100 IRE and 9100K at 30 IRE. (Pre-calibration measurements are not plotted in the accompanying graph.) Backing off the color-temperature setting to —2500K reduced that to 7600K at 100 IRE and 6200K at 30 IRE.
I experimented with three of the P50's gamma settings: Dynamic, Fine, and Real2. Of these, Real2 and Dynamic produced the best post-calibration gray-scale results (see graph). The Fine mode, despite its less-than-ideal gray scale, had better black-level retention than Real2. The bottom line: I alternated between Fine and Real2, depending on the program material. I didn't often use Dynamic with high-quality program material, however; it looked a little too punchy and realer than real–or realer than reel (pun intended).
The gray-scale results shown in the graph were very close to the correct coordinates for true D6500, with the exception of the readings above 60 IRE at the Fine setting. The red (x=0.643, y=0.348), green (x=0.286, y=0.647), and blue (x=0.153, y=0.079) color points of the display indicate a red shifted slightly toward orange (a very common deviation in consumer displays), blue marginally shifted to greenish-blue (but not visibly so), and green shifted into a deeper green than the standard. The green deviation was the most pronounced, which may indicate why bright greens could look too "electric" on the P50.
Using the test patterns on the Video Essentials DVD, I measured contrast three different ways, with the Picture controls set for the best results with real program material and the gray scale calibrated. Comparing a full-screen 100 IRE flat field (a full white screen at maximum brightness, such as chapter 18-14 on Video Essentials) to a black screen (the set turned on but switched to an open input), I obtained contrast readings of 743 in the Real2 setup, 1055 in Fine. Next, using the averaged readings from the checkerboard pattern on Video Essentials (chapter 17-28), I measured ANSI contrasts of 170 in Real2, 168 in Fine. And comparing the widest maximum to minimum adjacent values in the checkerboard (this is how contributor Peter Putman takes his peak contrast measurements), I got 199 in Real2, 183 in Fine–very close to the ANSI average result.–TJN
|
| |||||||||


| Displays Electronics Speakers | Sources Other Gear Software | Top Picks of the Year Top Picks | Custom Install How To Buy How To Use |
Tech 101
|
Latest News Features Blogs | Resources Subscriptions |
WHERE TECHNOLOGY BECOMES ENTERTAINMENT
 © 2026 Sound&Vision
AVTech Media Americas Inc., USA
All rights reserved

