- REVIEWS
Displays Electronics 
Speakers Sources Other Gear Software - HOW TO
How To Buy How To Use Tech 101
Pioneer Elite PRO-1130HD Plasma Display System Testing and Calibration
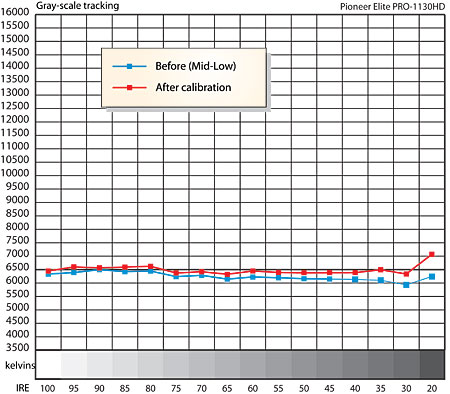
Out of the box, the Mid-Low Color Temperature setting was closest to the D65 standard (see "Before" in the accompanying table). After calibration, the result was noticeably improved, not so much in the actual degrees Kelvin, but closer to the true D6500 standard (within +0.004/-0.002 of the D6500 x/y coordinates on the CIE color chart from 30IRE to 100IRE; +/- 0.004 is usually considered an acceptable deviation).
The PRO-1120HD had exhibited a slightly rosy cast that I was never able to eliminate entirely. The PRO-1130HD, however, did not. Its grayscale was near ideal in all respects Overall, it not only looked excellent on color programming (which can conceal subtle tints), but on black and white material as well (which cannot).
The color points (measured in the Movie mode, but with the controls tweaked for the best image) exhibited the sort of deviations that are commonplace in the digital display world. While red and blue were a bit closer to correct than we usually see, green was far too saturated.
A day before we had to put this review to bed, I learned from Pioneer that the "Pure" picture mode was designed to provide the same color gamut as a CRT-based professional studio monitor. You won't learn this from the manual, which only hints at it by saying, "[Pure] reflects input signals as faithfully as possible. You may use this option to check image materials, for example."
While there was no time to test this assertion and still make my deadline for posting this report, I do plan to look into it further. Watch for a "Take Two" on this subject soon.
The Pioneer's overscan measured 1.5% on all sides in HDMI and component, and 2.5% to 3.5% in component 480p/i. With an HDMI source, the panel would not display below black.
Resolution, as measured using my AccuPel test pattern generator, uncovered the primary weakness of the Pioneer (the comments here are generally applicable to both the color and black and white results). With HDMI the response at 720p held up to 18.5MHz, but was significantly down in level at 37.1MHz. At 1080i, the response rolled off significantly above 12.4MHz, was noticeably reduced by 18.5MHz, and essentially gone at 37.1MHz. In 480i/p the response was still strong at the 6.75MHz/13.5MHz limits (respectively) of the test pattern generator.
Testing component at 480i, the 6.75MHz area of the multiburst was essentially invisible. It extended to 13.5MHz with 480p, but was significantly down in level at that frequency. With 720p component, there was no significant response visible above 18.5MHz, and with 1080i component, there was little visible information above 12.4MHz. None of these limits appeared to seriously affect the visible results on normal program material (in fact, the HD output of my cable box is component only). This suggests that current HD sources (either the signals from the cable company, or the set-top boxes themselves) do not use the full bandwidth of the HD format.
The peak contrast ratio usually compares the measured brightness of a 100IRE (peak white) full screen test pattern to the measured light on the screen when displaying a full screen video black. But because of power supply and consumption characteristics, the white level in a 100IRE window pattern can be more than twice as bright as in a 100IRE field that fills the entire screen. So which reading should we use for the peak contrast ratio?
My gut feeling is that the window pattern is more representative of real program material, but I'll give you both results here. With the contrast control set for a comfortable, unclipped light output, I measured a peak contrast of 1124:1 from the white window/video black (38.21 foot-Lamberts/0.034fL). The full white field measurement was 519:1 (17.65 peak/0.034 video black). With the contrast control turned up to just below white clipping (a setting of 38), the peak contrast measured 1532:1 using the white window (52.1fL/0.034fL) and 539:1 using the full white field (18.34fL/0.034fL). These peak readings aren't all that impressive, but the subjective contrast looked noticeably better. All the readings were made using a Minolta LS-100 light meter.
The video processing, scaling and deinterlacing of the Pioneer was among the best I've seen using my usual cocktail of torture tests from the Silicon Optix HQV Benchmark and Faroudja test DVDs. The Pioneer resisted jagged edges as well as any other set I've seen. The only patterns it had any trouble with were the flag-free 3:2 pulldown test on the Faroudja disc (where the Pioneer never fully captured the 3:2 cadence), and a video scroll over a film background (in which the scroll was obviously jagged with PureCinema in Standard or ADV, OK in Off). The two noise reduction controls also did a surprisingly effective job of reducing noise (at least on DVD) without seriously compromising image detail.
|
| |||||||||


| Displays Electronics Speakers | Sources Other Gear Software | Top Picks of the Year Top Picks | Custom Install How To Buy How To Use |
Tech 101
|
Latest News Features Blogs | Resources Subscriptions |
WHERE TECHNOLOGY BECOMES ENTERTAINMENT
 © 2026 Sound&Vision
AVTech Media Americas Inc., USA
All rights reserved

