Very well written! Thanks for the insight on the 2D/3D Calibration.
- REVIEWS
Displays Electronics 
Speakers Sources Other Gear Software - HOW TO
How To Buy How To Use Tech 101
Samsung UN46C8000 LCD 3D HDTV HT Labs Measures
HT Labs Measures
2D:
Black: 0.001
White: 35.4
Full-On/Full-Off Contrast Ratio: 35,400:1
3D:
Black: 0.001
White: 10.4
Full-On/Full-Off Contrast Ratio: 10,400:1
The measurements here were taken in the Movie mode, adjusted for the most accurate picture. Except as noted, the Contrast was set to 80, the Brightness to 45, the Backlight to 10, and the Gamma to 0. The Smart LED feature was on Standard (one of its three active settings). In much of the subsequent viewing, the Backlight was reduced to 6, the Contrast to 75, and the Color to 45.
The 3D readings were also taken in the Movie mode, but here the Contrast setting, by default, was at 100 and the Backlight was at 20.
All of the 3D measurements were taken with one lens of the 3D shutter glasses placed in front of the meter. At present, there are no suitable sources of 3D test patterns, so I used 2D patterns and set the 3D menu to the 2D-to-3D mode to ensure that the full effect of the shutter glasses was included in the measurements. In other words, as far as contrast and color are concerned, the meter saw what the eye sees.

2D
3D
Our Minolta LS-100 light meter had a difficult time reading the Samsung’s full-screen black level, which oscillated between 0.000 and 0.001 foot-lamberts. In practice, when a source fades to true black, the LED edge lighting on the Samsung shuts down, and the screen completely disappears in a darkened room. The black-level measurements above were taken from the black field with the PLUGE bars pattern from Digital Video Essentials: HD Basics. While the PLUGE bars in this pattern are small, very low in level, and well to the sides of the dark center where the measurements were taken, their presence may have been enough to cause the readings to toggle out of total black. In any case, this result is impressive.
However, the black level increases noticeably when any part of an otherwise totally black screen has one or more bright highlights.
The dramatic loss of brightness in 3D is the inevitable effect of the 3D glasses and the necessary processing. The result shown here is the maximum brightness available from the set in 3D Mode; there are no control settings that will increase it.
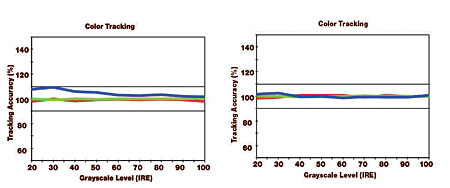
The Color Tracking charts show how well a display adheres to the D65 standard white point across the brightness range; the tighter the overlap of the three primary colors, the nearer the result is to D65. There are two sets of charts here, one for 2D operation (page 25) and one for the 3D mode (left). Both were taken in the Warm2 Color Tone setting. The 2D Before Calibration result is only fair; the After Calibration result, which used both the two-level and 10-level White Balance adjustments, is excellent. The final 2D Delta E numbers ranged from a maximum of 2.32 to a minimum of 0.82.
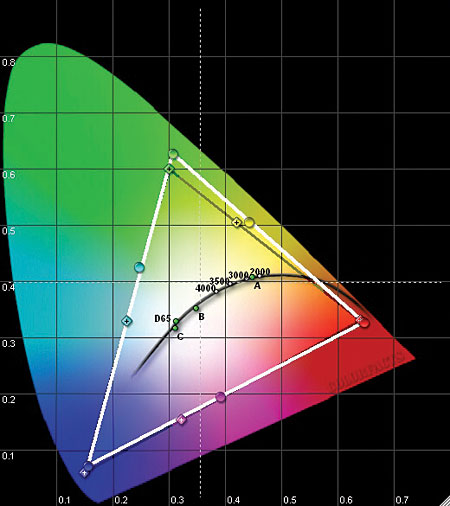
The 2D color gamut isn’t perfect, but in the Auto Color Space setting, it was near enough to the Rec. 709 standard that the use of the color management system (in the Custom Color Space menu) wasn’t likely to make a visible difference. That doesn’t make the Custom Color Space feature superfluous, though. Samples vary and sets age, so the ability to manipulate the color gamut is always welcome.
2D
3D
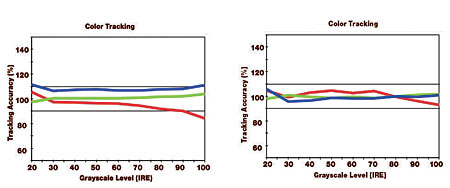
The 3D Before Calibration result shows a clear need for calibration. The 3D After Calibration result is an improvement. It’s inferior to the 2D result, but the 3D White Balance adjustments are two-level only; there are no 3D 10-step adjustments for fine-tuning. Nevertheless, the 3D After Calibration Delta E readings were at or below 4.1 from a very dark 30 IRE to a bright 90 IRE. (The Delta E was 7.03 at 20 IRE, the lowest level for which we can take a reasonably accurate measurement.)
When low-brightness, post-calibration 3D test patterns were viewed without the 3D glasses, they had a pronounced green shift. This was not visible through the glasses.—TJN
NEXT: Settings »
|
|
| ||||||||||
- Log in or register to post comments


| Displays Electronics Speakers | Sources Other Gear Software | Top Picks of the Year Top Picks | Custom Install How To Buy How To Use |
Tech 101
|
Latest News Features Blogs | Resources Subscriptions |
WHERE TECHNOLOGY BECOMES ENTERTAINMENT
 © 2024 Sound&Vision
AVTech Media Americas Inc., USA
All rights reserved