- REVIEWS
Displays Electronics 
Speakers Sources Other Gear Software - HOW TO
How To Buy How To Use Tech 101
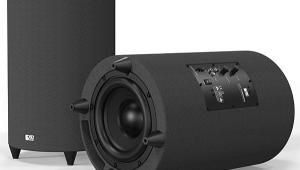
Test Report: Bowers & Wilkins MT-60D Home Theater Speaker System Page 4
Test Bench
Frequency response
- satellite (horizontal) 90 Hz to 20 kHz ±2.6 dB
- satellite (vertical) 90 Hz to 20 kHz ±4.5 dB
- subwoofer 21 to 395 Hz ±3 dB
Sensitivity (SPL at 1 meter/1 watt)
- satellite 83.4 dB
Impedance (minimum/nominal)
- satellite 3.8/7 ohms
Bass output, subwoofer (CEA-2010A standard)
Ultra-low bass (20-31.5 Hz) average: 95.1 dB
- 20 Hz: 91.4 dB
- 25 Hz: 94.6 dB
- 31.5 Hz: 98.1 dB
Low bass (40-63 Hz) average: 114.3 dB
- 40 Hz: 111.1 dB L
- 50 Hz: 114.7 dB L
- 63 Hz: 116.3 dB L
Bass limits
satellite 81.0 dB at 40 Hz
I measured the M1 satellite speaker with the microphone placed at a distance of 1 meter, using quasi-anechoic technique to remove the effects of reflections from nearby objects. I measured it on its provided base, which was in turn placed atop a 2-meter-high stand, measuring the speaker in both horizontal and vertical positions. I adjusted the microphone position for the flattest on-axis response, then averaged the measurements at 0°, ±10°, ±20°, and ±30°, smoothed to 1/12th octave. Bass response was measured using ground plane technique with the microphone on the ground 2 meters from the speaker; this was smoothed to 1/3rd octave, then spliced to the quasi-anechoic measurements at 150 Hz. Results are normalized to 0 dB at 1 kHz. All frequency response measurements were made with a Clio FW audio analyzer and then imported into a LinearX LMS analyzer for post-processing.
The M1 measures extremely flat on-axis. Off-axis, it develops some anomalies, but they’re pretty minor. To my surprise, the measurements average better with the speaker in the horizontal position; interference between the drivers usually makes measurements along the woofer/tweeter plane rough. Clearly this speaker has a well-engineered crossover that minimizes this interference. Horizontally, there’s a slight emphasis in the 1.7-to-2.8-kHz range, and otherwise it’s almost dead flat. Vertically, the same 1.7-to-2.8-kHz emphasis is there, but with a bigger boost between 6 and 9.5 kHz. The off-axis anomalies at 45° and 60° are relatively mild in both positions.
The impedance measurement (also performed with Clio FW) is pretty mild, with a low of 3.8 ohms at 20 kHz — no big concern because energy at that frequency is minimal in most recordings, and the phase angle at that frequency is 0°. The next-lowest dip is to 4.7 ohms and +7° at 67 Hz, safely outside the M1’s normal operating range. Sensitivity (average output on-axis between 300 Hz and 10 kHz with a 2.83-volt signal at 1 meter) is a little low at 83.4 dB, so I recommend giving the M1 at least 75 watts or so per channel to work with if you want to play it loud.
The subwoofer frequency response measurement you see here was taken by close-miking one of the two woofers, using the LFE input and EQ1 mode, and normalizing the result so that peak output measures +3 dB. The effects of the various EQ modes are pretty subtle, and you can see them in the accompanying chart. EQ1 (blue trace) is the flattest. EQ2 (red trace) introduces a bass boost of 3 dB centered at 62 Hz. EQ3 (green trace) is basically EQ1 with a 3-dB bass cut at 20 Hz. EQ4 (purple trace) is EQ1 with a 6-dB bass cut at 20 Hz. Pretty simple stuff, but EQ2 is useful if you want a little extra kick, and EQ3 and EQ4 could help reduce boom if the sub is placed in or near a corner.
CEA-2010A output measurements for the PV1D subwoofer were taken at 3 meters and then scaled up 9.54 dB per CEA-2010A requirements so that they are equivalent to 1-meter results.
Output in the low bass octave (40-63 Hz) is pretty solid for the PV1D’s size at an average of 114.3 dB, although that’s not impressive for the price. While the PV1D does have usable output down to 20 Hz, it’s not going to shake your couch much: Average output in the ultra-low bass octave (20-31.5 Hz) is 95.1 dB.
|
| |||||||||


| Displays Electronics Speakers | Sources Other Gear Software | Top Picks of the Year Top Picks | Custom Install How To Buy How To Use |
Tech 101
|
Latest News Features Blogs | Resources Subscriptions |
WHERE TECHNOLOGY BECOMES ENTERTAINMENT
 © 2026 Sound&Vision
AVTech Media Americas Inc., USA
All rights reserved

