- REVIEWS
Displays Electronics 
Speakers Sources Other Gear Software - HOW TO
How To Buy How To Use Tech 101
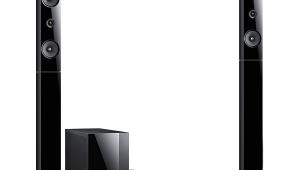
Sharp SD-SP10 HTIB HT Labs Measures
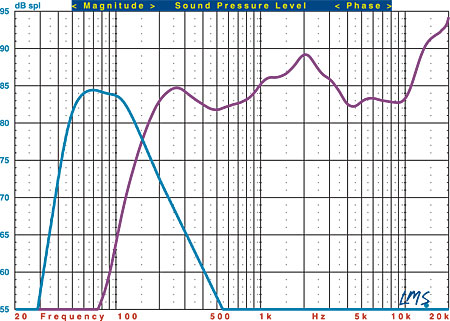
This graph shows the quasi-anechoic (employing close-miking of all woofers) frequency response of the left channel (purple trace) and the subwoofer (blue trace). The main loudspeaker was measured at a distance of 1 meter, with the grille on, in Standard mode and scaled for display purposes. Please note that the closed, proprietary nature of this product precluded many of our usual tests.
The left channel's listening-window response (a five-point average of axial and +/–15-degree horizontal and vertical responses) measures +4.69/–3.34 decibels from 200 hertz to 10 kilohertz. An average of axial and (+/–15-degree) horizontal responses measures +4.87/–3.21 dB from 200 Hz to 10 kHz. The –3-dB point is at 186 Hz, and the –6-dB point is at 160 Hz.
The subwoofer's close-miked response, normalized to the level at 80 Hz, indicates that the lower –3-dB point is at 50 Hz and the –6-dB point is at 45 Hz. The upper –3-dB point is at 127 Hz.—MJP
|
|
| ||||||||||


| Displays Electronics Speakers | Sources Other Gear Software | Top Picks of the Year Top Picks | Custom Install How To Buy How To Use |
Tech 101
|
Latest News Features Blogs | Resources Subscriptions |
WHERE TECHNOLOGY BECOMES ENTERTAINMENT
 © 2025 Sound&Vision
AVTech Media Americas Inc., USA
All rights reserved

