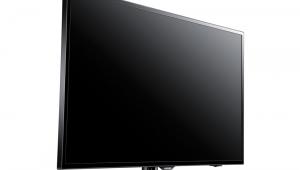
Samsung UN75ES9000 3D LCD HDTV HT Labs Measures
All the 2D measurements here were taken in the Movie mode, adjusted for the most accurate picture. The backlight was set to 9, Contrast to 80, Brightness to 46, Gamma to +1 with Cinema Black on, and Smart LED in Standard.
The full-on/full-off contrast ratio above was calculated at the settings indicated from a measured peak white level of 29.66 foot-lamberts and a full black field reading of 0.001 ft-L. The latter is the lowest reading possible from our Minolta LS-100 light meter. When taking this black reading, we left the pause bug from our Oppo Blu-ray player displayed in the upper left-hand corner of the screen to simulate a very dark but not totally black image. Without this bug, the screen’s LED backlighting turns off completely, producing a 0.000-meter reading and an infinite contrast ratio. The latter will not be achievable with real program material except when the source goes to full black, most commonly on fadeouts between scenes. With such a zero picture level source, the screen completely disappears from view in a fully darkened room.
The peak brightness indicated above is not the set’s maximum possible brightness, though it’s approximately the peak comfortable brightness in a darkened room. With the backlight turned up to maximum (20) and the Contrast to 100, the peak white level in the Movie mode was 88 ft-L. In the Standard mode at the same settings, the peak brightness jumped to 138 ft-L.
The RGB Balance charts show how well a display adheres to the D65 standard white point; the tighter the match of the three primary colors, the nearer the result is to D65 at each point in the brightness range. Before calibration in the Warm 2 Color Tone (color temperature) setting, the Delta E averaged a good 2.12, never rising above 3.15. Post-calibration, using both the two-point and the 10-point calibration controls together, the maximum Delta E in 2D was 0.75, with an average of 0.43.


The CIE chart shows that the Samsung’s color gamut closely matches the Rec. 709 standard. The adjustments made to the Color Space (color gamut) control to achieve this result were small and likely visibly insignificant. The average color Delta E after calibration was 1.64.

All of the color results and charts provided here, together with additional data, were obtained using SpectraCal CalMAN, SpectraCal.com
The set was quite watchable in either 2D or 3D without a full color calibration, but the improvements made by the 3D calibration were significant (charts not shown). Prior to calibration, the 3D gray-scale Delta E averaged 14.69; after calibration, it averaged 1.78 and would have averaged lower were it not for isolated (and visibly inconspicuous) blips at 50 percent (5.53) and 100 percent (7.13). At no other points did the Delta E exceed 0.85. Post-calibration, the 3D color Delta E averaged 1.65, down from 6.34 pre-calibration.
With a +1 setting of the Gamma control, the average 2D gamma measured 2.15 and the 3D gamma just under 2.0. Lower settings of the control will increase the gamma. Because the gamma was slightly nonuniform (not unusual, particularly on a display with dynamic lighting), the optimum gamma varied from –1 to +1, depending on the source.—TJN

