- REVIEWS
Displays Electronics 
Speakers Sources Other Gear Software - HOW TO
How To Buy How To Use Tech 101
BenQ PE7700 Single-chip DLP Projector Tests and Calibration
Using standard and high-definition test patterns from my AccuPel HDG-3000 test pattern generator, the PE7700 had good black level retention as the average picture level changed. Its overscan, however, was a little high, ranging from 3-5% depending on the resolution and input (analog, component or HDMI).
The projector's luminance frequency response (as seen on multiburst patterns) at 720p extended cleanly to 18.5MHz, with some useful response up to 37.1MHz, on both component and HDMI. The color response was similarly wide, though it clearly rolled off faster above 18.5MHz. At 1080i, some noise was observed in both the 18.5 and 37.1 multibursts in component, but not HDMI. But while the response was down more at 37.1MHz than in 720p, there was still resolution visible at the higher frequency. The color response at this resolution was barely visible at 37.1MHz. Both color and luminance response held up well at 480i and 480p to 6.75MHz and 13.5MHz respectively. None of these results appeared to obviously affect the performance of the projector with normal video material, though it might account for the slight softness I observed in the image.
BenQ claims a proprietary video processing/scaling engine for the PE7700, but the results looked exactly like the sort typically seen from Faroudja deinterlacers. I found no significant aberrations or artifacts worth mentioning in any of my standard deinterlacing and scaling tests. Perhaps more significant is the fact that the projector will not accept a 480i source at its HDMI input. It's true that few DVD players offer this output option, but if yours does and you can't use it you're limited to using the player's deinterlacer with an HDMI connection. The deinterlacer in the player may not be as good as the one in this projector.
With the lamp in Economic mode (at about 130 hours of use) I measured a peak light output from the BenQ of about 19.3 foot-Lamberts on my 78-inch wide, 1.3 gain white screen. In Full lamp mode the top-end output increased to 22.7fL. The peak contrast ratio measured about 1379:1 (19.3fL peak white, 0.014fL video black) in Economic lamp mode, and 1335:1 (22.7fL / 0.017fL) in Full. The pseudo-ANSI contrast measured 258 in Economic mode —typical for an off-screen measurement of a single-chip DLP in my light-controlled but not black-painted studio. In all cases these measurements were made with the projector calibrated and setup to produce the best, most accurate images possible on both test patterns and normal program material, not the highest contrast numbers obtainable regardless of picture quality.
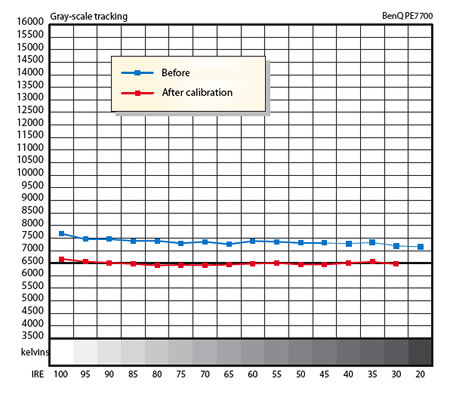
I obtained the best out-of-box color temperature readings in the Warm factory setting (see the "Before" curve in the accompanying graph). After calibration, the gray scale was admirably even across the board. Just as important, the x/y coordinates of the individual readings were as close to the D6500 standard (x=0.313, y=0.329) as we have ever measured, with deviations of 0.002 or less across the board.
The red, green, and blue color points were similarly very close to correct—again, as close as any I have measured except for the Samsung SP-H700AE, in which the correct coordinates are directly entered as part of the calibration process, and the Yamaha DPX-1200, which provides adjustments that allow you to move the points to the correct position with the proper test tools (at least in our sample).
|
| |||||||||


| Displays Electronics Speakers | Sources Other Gear Software | Top Picks of the Year Top Picks | Custom Install How To Buy How To Use |
Tech 101
|
Latest News Features Blogs | Resources Subscriptions |
WHERE TECHNOLOGY BECOMES ENTERTAINMENT
 © 2025 Sound&Vision
AVTech Media Americas Inc., USA
All rights reserved

