I only have Netflix, Amazon, and Cable TV. A Gen X'er who subscribes to less services than the Silent Generation. I barely have enough time to watch what I'm paying for now, so I couldn't imagine paying for even more services. I guess I'm just cheap.
Survey: Content Discovery Is the Key Drawback in the Age of Streaming
TV has been a constant and growing presence in the lives of Americans ever since the Texaco Star Theater transitioned from radio to television in the late 1940s, creating TV’s first superstar — Milton Berle. By early 1960s, Lucille Ball and Desi Arnaz were household names and nine out of 10 American families were proud owners of a TV — most were black-and-white but color sets were slowly making inroads. Five of the 10 top shows in the 1960-61 season were western-themed with Gunsmoke leading the pack. Other popular shows included Candid Camera, The Price is Right (talk about staying power), The Ed Sullivan Show, Perry Mason, and a few dozen other quaint programs you can watch on MeTV to this day. Leave It to Beaver, anyone?
Television was — and still is — America’s favorite pastime but the landscape has changed dramatically over the years, in ways that early pioneers of the small screen might not have imagined. From broadcast to cable to satellite to streaming and all of its many faces, the content keeps coming from studios big and small, old and new, known and unknown. Throw YouTube into the mix and it’s all but impossible to count today’s TV viewing options.
And therein lies the problem…
What to watch or, more to the point, how to figure out watch to watch. “Content discovery,” as the industry pundits like to call it, is the No. 1 “pain point” among an American/Canadian public that watches 4.4 hours of television a day, according to latest edition of TiVo’s biannual Video Trends Report. Discovering new and relevant video content is a bigger issue than what we pay each month for the programs we want to watch (or think we want to watch).
In the days before cable TV, it was easy: You put up an antenna and tuned into one of the three or four channels you could get. When cable arrived, it provided many more options out of the gate, eventually reaching the point where Bruce Springsteen’s 1992 song “57 Channels (And Nothin’ On)” was quaint. If today’s cable subscribers watch more than a handful of the hundreds of channels they pay for every month (don’t get me started on cable bundles), I’d be surprised. And with the advent of streaming, the number of programs at our disposal escalated rapidly, eventually reaching the stratosphere. At the end of 2021, Forbes put the number of streaming services operating in North American alone at around 50. Go beyond the U.S. and Canada, and you’re likely looking at a couple hundred services.
So we have more TV viewing options than ever before but with that “blessing” comes the curse of not only having to figure out where to get the movies and TV shows/series we want to watch but then having to pay for what, ultimately, becomes a patchwork of services we cobble together. At what point does your stable of streaming services equal or surpass the cost of cable TV? (And, if you’re a millennial, I get it: you’re thinking cable? — are you kidding?) Many of us are already there.
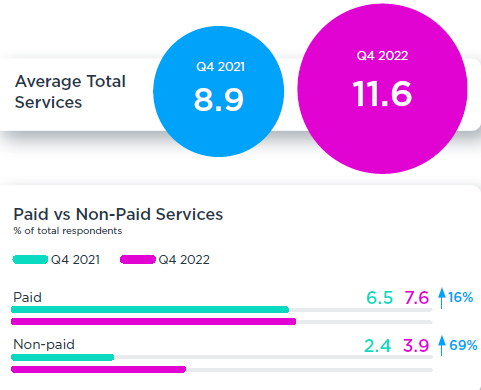
Remarkably, even in the face of high inflation and lingering economic uncertainty, Americans and Canadians are getting their TV fix from an average of 11.6 (paid and unpaid) streaming services, up from around nine a year ago, according to the TiVo report. And for those who still subscribe to cable TV — around 68 million in the U.S., down from 90 million five years ago — the average number of streaming sources is pushing 13 (12.7). Hard to believe, actually. I guess I’m a minority player when it comes to streaming. How about you?
So, while we might be going out to eat less frequently and cutting back on spending on food and clothing, we aren’t necessarily reducing our monthly TV entertainment bill. Almost 70% of survey respondents describe video as a moderate to high priority when it comes to discretionary spending on entertainment and 74% say they are slightly or much more likely to look for entertainment at home instead of going out.
Even so, those surveyed admit to evaluating and adjusting their entertainment spending more often these days, with 17.6% doing so every month, compared with 11.4% in 2021. The survey also revealed that respondents with a higher household income actually evaluate spending more often than those in lower income brackets.
And there’s no denying the lure of free, even if it means you have to sit through commercials. The report found that almost two-thirds (63.5%) of respondents subscribe to one or more free, ad-supported services, up from 60.4% in 2021. Roku, Tubi, and Peacock were the top three, though the percentage of those watching via Peacock slipped by several percentage points in 2022 and is likely to lose more ground in light of the recent announcement that it has discontinued its free tier for new customers.
More than half of survey participants in each of five demographics describe themselves as ad-tolerant, with the percentage ranging from 51% for millennials (26-41 years old and the least tolerant group) to 68% each for the Silent Generations (77+) and Baby Boomers (58-76). Gen Z (18-25) came in at 58.4% and Gen X (42-57) at 62%. Looked at in terms of socioeconomic status, those earning $200,000 or more in household income are most likely to be in favor of commercials.
Now for the 64 million dollar question…
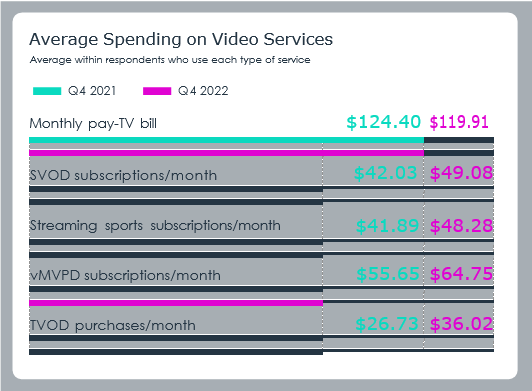
How much do Americans and Canadians spend a month on TV? The survey looked at five type of video services and found that pay TV (cable, satellite) subscribers pay on average $119.91/month, down from $124.40 a year earlier. SVOD (subscription video on demand) services a la Netflix are a distant second at $49.08/month, up from $42.02. The next three categories (see chart above) ranged from $48.28/month to $36.02/month. Interestingly, survey participants report spending more than they did the previous year in all of the categories except for pay TV. Again, TV is a clear priority.
When you look at average number of TV sources by generation, we see that millennials have a voracious appetite for TV:
• Gen Z (18-25 years old): 12.7, up 10.6% from a year ago
• Millennials (26-41): 16.3, up 26.3%
• Gen X (42-57): 12.2, up 47%
• Baby Boomers (58-76): 6.2 (up 21.9%
• Silent Generation (77+): 5.1 (up 32.3%)
And if we break it down by paid vs. non-paid services (see chart below), we find that as the overall number of sources has increased, so too has the share of non-paid services. In other words, free ad-supported streaming TV (F.A.S.T.) is capturing a growing share of eyeballs.
Looking at TV sources through the lens of income level, we see that the number of subscriptions is directly correlated to income, with households earning over $200,000 getting TV from an average of 21.1 sources, compared with fewer than 10 for those earning $80,000 or less. Another interesting tidbit: On average, men get TV from about 5 more sources than women.
Social on the Big Screen
Putting organized streaming services aside for a moment, the Video Trends Report also confirms what many of us already know: social video and user-generated content continues to find its way into the living room more so than ever before. Almost a third (29.1%) of the survey’s respondents watch videos on YouTube, Facebook, TikTok, and other social platforms on the big screen. What’s more, almost two-thirds (63.4%) of them spend most of that time watching user-generated content (USG). One of my favorites is Rick Beato’s Everything Music channel on YouTube. How about you?
Not surprisingly, the issue of what’s real and what’s fake looms large. Half of social video adherents worry that the content may be inauthentic or posted by somebody pretending to be someone else. We’ll skip getting into politics here for the greater good…
If we break social viewership down by age, we find that Gen Zers (95.3%), millennials (92.7%), and Gen Xers (84.7%) spend the most time watching one or more USG channels. There’s a clear age correlation here. On the flipside, just over a third (36.4%) of the social video group say they mostly watch news segments, comedy sketches, or sports highlights on other platforms.
The Discovery Dilemma
Back to the challenge of finding shows we want to watch. Most of those who participated in the TiVo survey report being frustrated not only over having too many streaming services in their personal bundle but by how frequently movies and TV shows appear and disappear on the services they subscribe to. Put in simple terms, we want a practical and effective way to navigate the sea of services — it’s the Holy Grail of TV search and discovery, if you will.
Right now, almost half of survey respondents find new TV shows and movies by word of mouth (47.9%) or through ads seen on other shows they watch (46.5%). From there, just over a third (35.6%) turn to social media and about a third (32.2%) rely on display ads on the home screen of online video services. Suggestions in “my TV channel guide or other menus” is cited by just over a quarter (27.1%) of those surveyed, and more than half (55.9%) of those who follow recommendations to find content say they’re satisfied with the suggestions.
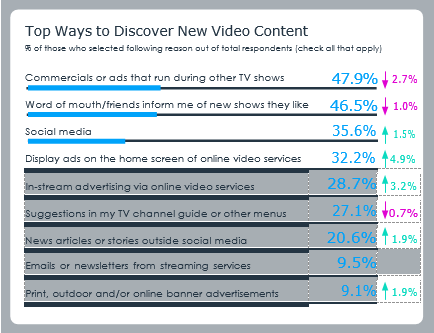
Meanwhile, a full third-plus (35.4%) remain indifferent and only 8.7% report being unhappy with the recommendations. Getting right to the heart of the thumbs up/thumbs down content discovery experience pioneered by TiVo almost 25 years ago — simplistic by today’s standard but trendsetting nonetheless — more than half of survey respondents are willing to actively teach a streaming service about their preferences to get better recommendations, with pay-TV subscribers even more likely to do so (60.3%), compared with “broadband-only subscribers” (47%) — those who pay only for internet service.
Going forward, artificial intelligence (AI) will continue to improve and play an even greater (and potentially more satisfying) role here.
TV Still a Mesmerizing Presence
In a speech before the National Association of Broadcasters in 1961, FCC Chairman Newton Minow extolled the virtues of “good” television before famously referring to “bad” TV as a vast wasteland: “When television is bad, nothing is worse. I invite each of you to sit down in front of your television set when your station goes on the air and stay there, for a day, without a book, without a magazine, without a newspaper…to distract you. Keep your eyes glued to that set until the station signs off. I can assure you that what you will observe is a vast wasteland.”
Some things never change. I would argue that the worst of today’s bad television is far worse than what Minow was referring to (and something he couldn’t have imagined at the time). There is, of course, plenty of compelling programming today, which explains why Americans and Canadians spend on average 4.4 hours a day watching TV, slightly down from 4.5 hours in 2021 when Covid was still a looming issue.
Where, specifically, do people get their TV? The Video Trends Report confirms that half (49.6%) of respondents subscribe to one or more pay-TV services, with the remaining 50% split between “virtual multichannel video programming distributors” or vMVPDs (18.6%) such as YouTube, Pluto TV, and Sling where viewers select from a “skinny bundle” of live and on-demand content delivered over the internet, free broadcast TV received over the air via an antenna (10.4%), social media apps (7.7%), and free, ad-supported streaming services (6.4%).
If we isolate the 8-11 p.m. prime time viewing slot to see which types of TV services are most popular, we find that “subscription video on demand” (SVOD) services like Netflix or Disney+ and pay TV (mostly cable) each command 42%, with free ad-supported services at 35.8% and the YouTubes and Slings of the “vMVPD” world at 26.4%.
When it comes to viewer preferences, bingeing is still the name of the game. Almost six in ten respondents (58%) prefer when a whole season of a TV show is available at once, compared with a quarter (24.3%) who prefer when series’ episodes are released weekly. Bingers like being able to set their own pace for watching a show, while the latter group prefers having something to look forward to every week.
As the World Churns
Though we’ve covered a fair amount of ground, TiVo’s Video Trends Report covers a range of other findings worth highlighting. Unless otherwise noted, percentages below relate to the proportion of all survey respondents.
• 28.8% plan to drop cable TV, or “cut the cord,” in the next six months, up from 24.2% in 2021.
• 30.5% of current pay-TV subscribers noted they had previously dropped cable and later resubscribed. The top reasons for doing so included “not being able to get all the entertainment I wanted “(33.1%), “it’s the best way to watch major live events” (31.8%), “I like knowing I always have many channels available” (30.3%), and “it’s the best way to watch sports (29.2%) and local programming” (28.5%).
• 71.6% indicate moderate to significant interest in an option to purchase a pay-TV subscription with no long-term contract.
• Netflix is the most “churned” service by far. More than a quarter (27.3%) recently canceled the service. Hulu was a distant second with 9.1% reporting cancellation.
• 26.6% dropped an SVOD service in the last six months, up from 18.2% in 2021.
• 34.4% added an SVOD service in the last six months, up from 27.4% in 2021.
• Only 37.8% plan to keep a streaming service for more than a year on average.
• 73.6% own a smart TV, up from 69.7% in 2021.
• 25.9% plan to buy a smart TV in the next 6 months.
Findings of the Video Trends Report are based on a survey conducted in late 2022 of almost 4,500 Americans and Canadians aged 18 and up.
- Log in or register to post comments


Currently, I can hardly keep up with the content I already pay for, so adding more would be a waste of money. Just call me frugal, I suppose. cookie clicker

The survey highlights that the biggest challenge for consumers in the age of streaming is content discovery. With an overwhelming amount of content available, consumers struggle to find what they want to watch. This creates a need for better algorithms and personalized recommendations to improve the user experience. Additionally, the survey indicates that consumers are willing to pay for more personalized content discovery and curation drywall repair near me services.

colleyville texas bathroom contractor
The survey also revealed that respondents with a higher household income actually evaluate spending more often than those in lower income brackets.

I agree with this. This is perfectly explained. Thank you. roll off dumpster
