- REVIEWS
Displays Electronics 
Speakers Sources Other Gear Software - HOW TO
How To Buy How To Use Tech 101
Variations
| In the Lab | |
| Sensitivity (SPL at 1 meter) front left/right 92 dB center 89 dB surround 86 dB Impedance (minimum/nominal) front left/right 4.1/5 ohms center 4.1/6 ohms surround 4.7/12 ohms | Bass limits (lowest frequency and maximum SPL with limit of 10% distortion in a large room) front left/right 62 Hz at 74 dB center 80 Hz at 86 dB surround 80 Hz at 71 dB subwoofer 20 Hz at 84 dB SPL 104 dB average SPL from 25 to 62 Hz 108 dB maximum SPL at 62 Hz bandwidth uniformity 97% |
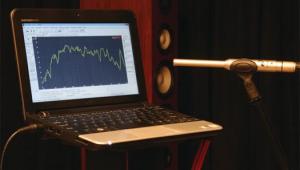
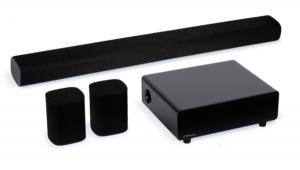
| All of the curves in the frequency-response graph are weighted to reflect how sound arrives at a listener's ears with normal speaker placement. The curve for the Take TWR left/right front speaker shows a mild floor-bounce dip centered at 250 Hz, a 3-dB depression between 7 and 12 kHz, and a sharp, narrow peak at 14 kHz. Sensitivity was above average. Off-axis lobing of the Take FPS center speaker began at 15°, which can be seen in the 3.3-kHz notch in its curve. The effect worsened further off-axis. The Take SAT had drooping low-frequency response but relatively extended highs for a surround speaker. Bass limits for the S10.3 subwoofer were measured with it set to maximum bandwidth and placed in the optimal corner of a 7,500-cubic-foot room. In a smaller room, you can expect 2 to 3 Hz deeper extension and up to 3 dB higher sound-pressure level (SPL). The S10.3 had above average dynamic capability, and the acoustical crossover points matched the dial markings closely. - Tom Nousaine | |
| In the Lab | |
| Sensitivity (SPL at 1 meter) front left/right 92 dB center 89 dB surround 86 dB Impedance (minimum/nominal) front left/right 4.1/5 ohms center 4.1/6 ohms surround 4.7/12 ohms | Bass limits (lowest frequency and maximum SPL with limit of 10% distortion in a large room) front left/right 62 Hz at 74 dB center 80 Hz at 86 dB surround 80 Hz at 71 dB subwoofer 20 Hz at 84 dB SPL 104 dB average SPL from 25 to 62 Hz 108 dB maximum SPL at 62 Hz bandwidth uniformity 97% |
| All of the curves in the frequency-response graph are weighted to reflect how sound arrives at a listener's ears with normal speaker placement. The curve for the Take TWR left/right front speaker shows a mild floor-bounce dip centered at 250 Hz, a 3-dB depression between 7 and 12 kHz, and a sharp, narrow peak at 14 kHz. Sensitivity was above average. Off-axis lobing of the Take FPS center speaker began at 15°, which can be seen in the 3.3-kHz notch in its curve. The effect worsened further off-axis. The Take SAT had drooping low-frequency response but relatively extended highs for a surround speaker. Bass limits for the S10.3 subwoofer were measured with it set to maximum bandwidth and placed in the optimal corner of a 7,500-cubic-foot room. In a smaller room, you can expect 2 to 3 Hz deeper extension and up to 3 dB higher sound-pressure level (SPL). The S10.3 had above average dynamic capability, and the acoustical crossover points matched the dial markings closely. - Tom Nousaine | |
- Log in or register to post comments


| Displays Electronics Speakers | Sources Other Gear Software | Top Picks of the Year Top Picks | Custom Install How To Buy How To Use |
Tech 101
|
Latest News Features Blogs | Resources Subscriptions |
WHERE TECHNOLOGY BECOMES ENTERTAINMENT
 © 2024 Sound&Vision
AVTech Media Americas Inc., USA
All rights reserved