- REVIEWS
Displays Electronics 
Speakers Sources Other Gear Software - HOW TO
How To Buy How To Use Tech 101
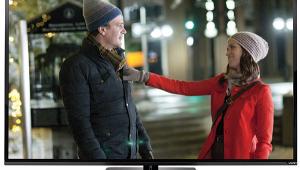
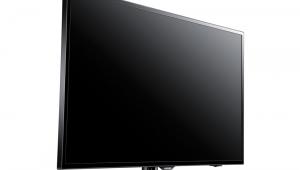
Sony KDL-55W900A 3D LCD HDTV HT Labs Measures
Full-On/Full-Off Contrast Ratio: Unmeasurable
All of the measurements here were taken in the Cinema 1 Picture Mode through an HDMI input. Unless otherwise noted, these results were for 2D operation.
With the Backlight set to 2, the Picture (contrast) control at 90, the Brightness at 50, the Gamma at 0, and the LED Dynamic Control on Standard, the measured peak white level was 30.4 foot- lamberts and the black level 0.00 ft-L. This does not mean the set has infinite contrast, only that the LEDs turn off in the presence of a black signal, such as fadeouts between scenes. When a small bright spot appears, for example a pause bug from a disc player in a corner of the image, the screen lights up to where you can just see its outlines. But the center remains dark enough to be below the measurable limit (0.001 ft-L) of our Minolta LS-100 light meter.
With the LED Dynamic Control off (defeating the dynamic dimming), the full-on/full-off contrast ratio dropped to a measurable 3,862:1 (black level 0.008 ft-L, peak white 30.9 ft-L). This is still respectable performance, but the set’s black level and shadow detail performance is visibly better with the LED Dynamic Control set to Standard.
Unlike many displays with dynamic dimming or a dynamic iris (as might be found in a projector), this Sony produced a respectably uniform gamma with its dynamic dimming operating. With the Gamma control set to 0 and LED Dynamic Control on Standard, the gamma averaged 2.19, ranging from 2.24 at 20 percent to 2.17 at 80 percent before dropping to 2.11 at 90 percent.
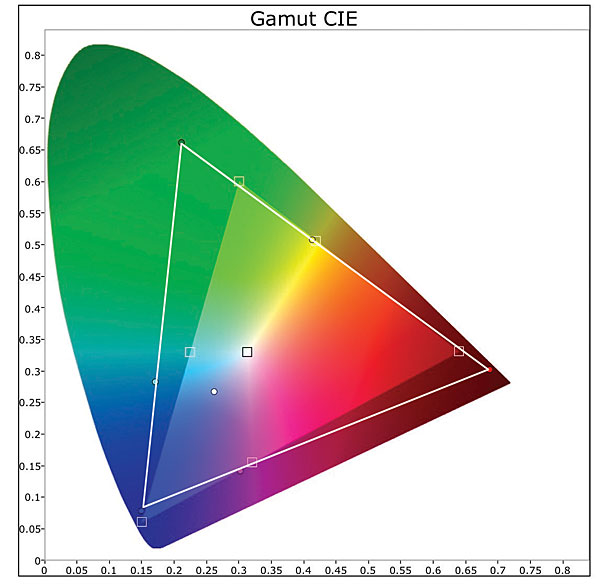
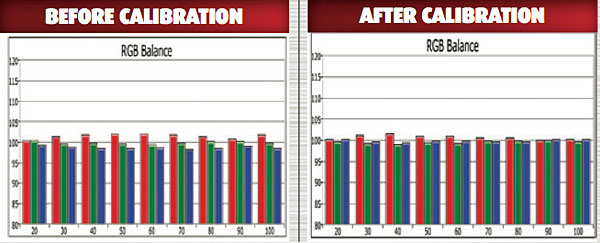
In the Warm 2 Color Temperature setting, the average pre-calibration gray scale Delta E was an impressive 1.1, with a maximum of 1.83 at 100 percent brightness. While this hardly required calibration, I did one anyway, since there’s no guarantee that every set coming off the production line will be this close to correct out of the box. Post cali- bration, the average gray scale Delta E was 0.44 and the maximum 0.64. (Delta E is a figure of merit indicating how close the color comes to the D65 HD standard at each point in the brightness range. Values below 3—some experts say 4—are generally considered visually indistinguishable from ideal.) The color gamut Delta E, Live Color off, was compromised by the blue results; the blue test pattern automatically faded in brightness after a second or so, providing an unreliably high reading. With blue included, the average color Delta E was 7.26, but none of the colors apart from blue had a Delta E higher than 1.72. Visibly, the set’s color is superb.
The set was also calibrated separately for 3D. The 3D charts are not shown. More work was needed for a good result than in 2D, but it paid off. The pre-calibration 3D gray scale Delta E averaged 8.34 (in the Warm 2 Color Temp setting), peaking at 12.98 at 100 percent brightness. Post calibration, the 3D gray scale Delta E averaged 0.69, with a peak of 1.48 at 100 percent brightness. The post-calibration color Delta E averaged 3.67.—TJN
|
|
| ||||||||||
- Log in or register to post comments


| Displays Electronics Speakers | Sources Other Gear Software | Top Picks of the Year Top Picks | Custom Install How To Buy How To Use |
Tech 101
|
Latest News Features Blogs | Resources Subscriptions |
WHERE TECHNOLOGY BECOMES ENTERTAINMENT
 © 2024 Sound&Vision
AVTech Media Americas Inc., USA
All rights reserved