- REVIEWS
Displays Electronics 
Speakers Sources Other Gear Software - HOW TO
How To Buy How To Use Tech 101
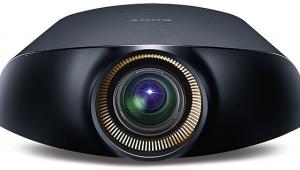
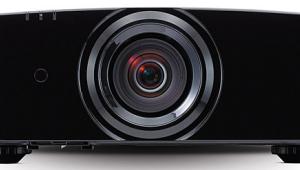
Sharp XV-Z30000 3D DLP Video Projector HT Labs Measures
Full-On/Full-Off Contrast Ratio: 8291:1
Except as noted, the results here are for the Sharp’s 2D performance on the Elite 101-inch-wide, 2.35:1 screen (gain 1.1), with the Sharp’s auto iris (Iris2) engaged.
The full-on/full-off contrast ratio can vary, sometimes widely, with the setup conditions—the lamp mode, the zoom setting (which will be determined by the screen size and throw distance), the setting on a projector’s iris, if present, and more. These conditions will be different for different installations. To keep matters under control here, I’ll present two different situations, an idealized but still achievable one, and the setup I used for most of my viewing.
The full-on/full-off contrast ratio result shown at the top of this section was taken under the following conditions: the projector set up to produce a 96-inch-wide picture at a throw distance of 13 feet, 11 inches (this establishes the zoom setting, which affects image peak brightness and contrast), Iris1 (Manual) on High Contrast, Iris2 (Auto) on, Eco+Quiet off (high-lamp mode). This screen size and throw distance combination was chosen because it falls somewhere in the middle of a range of setups that are workable for most users. The Brightness and Contrast controls were then set so that the projector displayed video brightness levels from 17-242 (the video brightness range covers the levels from 16-235, so this setup offers about 3 percent headroom above video white).

Under these conditions, the measured contrast ratio was 8291:1. This number was obtained from peak white and black measurements taken at the lens by a Minolta T-10 illuminance light meter. If we use this contrast ratio together with the peak-white level of 15.81 that these conditions produced on a 96-inch-wide screen, we get a derived black level of 0.0019 foot-lambert. Repeating the measurements with the auto iris turned off reduces the contrast ratio to 1722:1 and increases the black level to 0.0096 ft-L (the peak-white output with the specified settings and the auto iris off was a slightly higher 16.48 ft-L). (Note that my current 1.3-gain StudioTek 130 is smaller than 96 inches wide, but with the peak-white measurement taken only at the center of a white-window test pattern, the image was simply zoomed out to simulate the larger screen.)

The conditions under which I did most of my viewing and measuring, however, were different. I mainly used the 101-inch-wide, 1.1-gain, Elite screen. With the Iris1 (Manual) in High Brightness for this screen, the full-on/full-off contrast ratio measured 4541:1. The corresponding peak-white level was just under 20 ft-L, resulting in a derived black level of 0.0045 ft-L. But in this setup, the Contrast control was set to cover the video-brightness range steps from 17-251, which provided more headroom at the top. Changing Iris1 to High Contrast on this screen and increasing the Contrast control to limit the top-end headroom to 242 (thereby maximizing brightness) resulted in a peak-white level of just under 15 ft-L. With High Contrast in the low-lamp mode (Eco+Quiet On), peak-brightness level dropped to 7.89 ft-L on this screen when set for 3 percent peak-white headroom. But I preferred the High Brightness/high-lamp settings, not only for the enhanced image punch but also for the enhanced headroom.
The color calibration results shown here were also taken on the 101-inch-wide Elite screen. The pre-calibration grayscale Delta E averaged an unimpressive 14.3. With the gamma control on 0, the gamma averaged 2.04—a bit low, but tolerable (the optimum setting varied somewhat with the source material). Post-calibration, the Delta E averaged an exceptional 0.565, and never higher than 1.06. (Delta E is a figure of merit that indicates how close the result comes to the HD standard: Rec. 709. Most experts judge a Delta E of under 3.0 to be visibly indistinguishable from ideal.) The gamma averaged 2.12 in the -1 setting, but with notable variations in the auto-iris mode (such variations are common with auto irises), it dropped below 2.0 in the mid-brightness region before increasing again at the top.
 The CIE chart shows the post-calibration color gamut. The average color Delta E was 5.33. Color gamut is the Sharp’s main shortcoming, and as noted in the review, the projector’s very limited color-management system was not used for these results.
Only the post-calibration 3D measurements are shown here. The grayscale Delta E increased to a maximum of 3.37 at 30 percent, 5.64 at 90 percent, and 5.08 at 100 percent brightness, but was never above 2.18 at any other point and averaged a respectable 2.85. The color Delta E averaged 5.2, and the overall 3D color gamut is similar to the 2D gamut.
- Log in or register to post comments


| Displays Electronics Speakers | Sources Other Gear Software | Top Picks of the Year Top Picks | Custom Install How To Buy How To Use |
Tech 101
|
Latest News Features Blogs | Resources Subscriptions |
WHERE TECHNOLOGY BECOMES ENTERTAINMENT
 © 2024 Sound&Vision
AVTech Media Americas Inc., USA
All rights reserved