Samsung FP-T5884 Plasma TV Measurements
Settings
Keep in mind that unit-to-unit variations, viewing environment, and source might render the settings I used less than optimum on some samples of this display. If you try these settings, I strongly recommend that you do so as a starting point, following up with one of the available display-setup DVDs to make sure that the basic picture settings are correct for your situation. Confirmation of the grayscale settings requires a full professional calibration.
Picture Menu
Mode: Movie
Contrast: 95
Brightness: 50
Sharpness: 0
Color: 45
Tint: R55/G45
Color Tone: Warm2
Size: Just Scan (16:9 for 480i and 480p sources)
Digital NR: Off
Active Color: N/A in Movie Mode
DNIe: N/A in Movie Mode
Detailed Settings
Black Adjust: Off or Low (program dependent)
Dynamic Contrast: Off
Gamma: -1 to +1 (program dependent)
Color Space: Auto
White Balance: All 15 (centered)
My Color Control: All 15 (centered)
Edge Enhancement: On
xvYCC: Off
Setup Menu
Film Mode: On (where selectable)
HDMI Black Level: Normal
Contrast & Resolution
Peak white level
Full screen 17.27fL
100 IRE window 47.5fL
Black level 0.029fL
Peak contrast ratio 1638:1
Overscan
480i/p 3% (Size = 16:9)
720p 0.5% (Size = Just Scan)
1080i/p 0.5% (Size = Just Scan)
Horizontal bandwidth at 1080i
HDMI/DVI 37.1MHz
Component 18.75MHz
The peak contrast ratio is about average for a flat panel. Those that can do better, however, often cost considerably more.
Because of power-supply limitations, the brightness of the image on a plasma display decreases as the average brightness level (also called the average picture level, or APL) of the source signal increases, though the change is generally invisible to the eye. Thus, the peak white level on a full-screen white image measures far lower than the peak white level of a small white window that fills only about 10-15% of the screen.
However, the APL of real-world images is generally closer to that of the white window, which suggests that the contrast you see in normal viewing from any plasma is likely to be closer to the value calculated with the white window measurement than the full-screen white, which is why we calculate the peak contrast ratio using the white-window measurement. This also puts plasmas on equal footing with LCDs, which do not lose brightness as the APL increases.
With a 1080i signal sent to the HDMI input and the aspect ratio set to Just Scan, the sharpness test pattern was virtually flawless, with a crisply defined, 1-pixel line. No edge enhancement was visible. Surprisingly, the Edge Enhancement control actually produced a subtle but noticeable sharpening of the one-pixel line without adding any clearly perceptible artifacts. So, contrary to my gut feelings about such controls, I turned it on for much of my viewing.
The 1080i luminance burst at 37.1MHz, the maximum required for full HD resolution, was beyond criticism. The color burst very nearly as good. At 720p via HDMI, in Just Scan mode, there was some rolloff at the maximum frequency of both the luma and chroma bursts, but they were nearly as good as 1080i. The results at 480p were also very good for that format. The set will not accept 480i over HDMI.
The component results were not as impressive. 1080i showed no usable resolution in the 37.1MHz burst. The same burst at 720p was satisfactory, but still noticeably rolled off. The 480i/p results were good for those formats. HDMI is definitely the preferred connection for this set.
Color As noted in the review, the Warm2 color temperature setting was so close to accurate that attempts to calibrate it resulted in no significant improvement. In fact, my attempt arguably produced a subtle degradation. So the data shown here reflect the factory Warm2 setting.
Figs. 1 and 2 show a close match to 6500K. In Fig. 2, a tight overlap of the red, green, and blue plots also indicates a close match to the D65 standard. A color temperature of 6500K is actually a line on the CIE color chart, so a color temperature of 6500K is necessary but not sufficient for a good calibration. D65 is the actual point on that line that defines the standard.
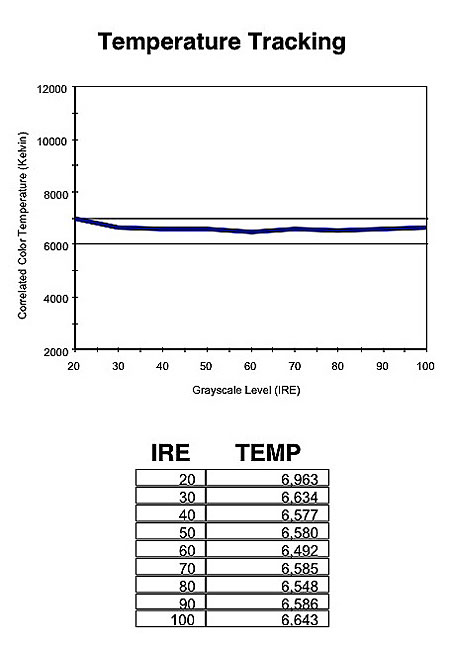
Fig.1

Fig.2
The coordinates that define D65 on the 1931 CIE chart are x=0.3127 and y=0.3290. The data plotted in Fig. 3 are the measured coordinates of these "white points" on the Samsung in Warm2, ranging from 20 IRE (minimum brightness) to 100 IRE (maximum). The darker the point, the closer it is to the minimum measured brightness. All the points except the one at 20 IRE are within an error range of 0.004—a limit that is generally accepted as a "good" result.
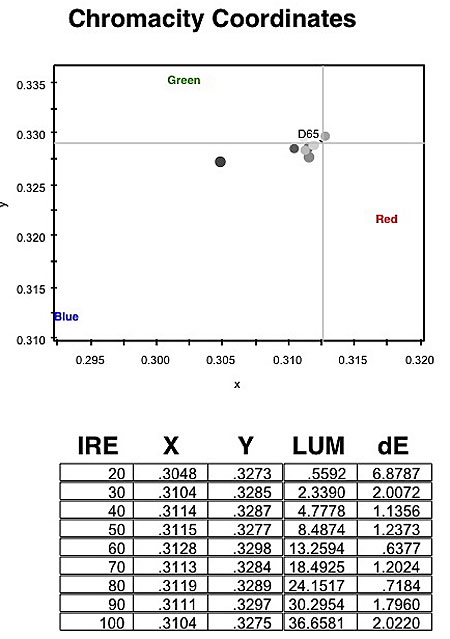
Fig.3
The primary color points on the Samsung are very close to the correct values with the Color Space set to Auto (Fig. 4)—in fact, closer than most sets I have measured. (The white triangle outlines the Samsung's color space, with the primaries at the vertices of the triangle; the black triangle encloses the standard Rec. 709 color space.)

Fig.4
Fig. 5 shows the result with the Color Space set to Wide. The colors are oversaturated here, and while this might appear to be better, it does, in fact, result in less accurate color from virtually all current consumer sources.

Fig.5
- Log in or register to post comments


