nice!
- REVIEWS
Displays Electronics 
Speakers Sources Other Gear Software - HOW TO
How To Buy How To Use Tech 101
Panasonic TC-P55VT30 3D Plasma HDTV HT Labs Measures
HT Labs Measures
Full-On/Full-Off Contrast Ratio: 4,187:1
All of the measurements here, unless noted otherwise, were taken in the Cinema or THX Picture mode, in 2D, through an HDMI input, and with the set adjusted as needed for the most accurate image in a darkened room.
Delta E, a number referenced in the following discussions, is a figure of merit that indicates how close a display’s color tracking comes to producing an ideal white balance (a specific 6500K point on the CIE color chart known as D65 or D6500). The lower the Delta E number, the better. Ideally, the Delta E will be identical at every brightness level, but in practice, it always varies. Experts generally agree that levels below 3 or 4 indicate a result that is visibly indistinguishable from perfect color tracking.

The full-on/full-off contrast ratio was determined from a measured peak-white level of 25.12 foot-lamberts and a black level of 0.006 ft-L. As noted in the review, this black level is slightly worse than the similar readings from last year’s TC-P50VT25, although it’s still highly competitive with the best of today’s sets. The best fully backlit, local-dimming LCDs can go deeper into black (they can turn off their LED lighting completely in dark areas), but these sets can have other issues that plasmas generally don’t.
The TC-P55VT30’s calibration shown here is for the THX mode. Before calibration, the result was only fair, with Delta E values ranging from a low of 3.42 to a high of 8.27 from 30 IRE to 100 IRE (13.71 at 20 IRE). After calibration, they were below 3.44 at every level except 30 IRE, where the value rose to 4.11. After calibration, the Delta E values in the Cinema mode (chart not shown) were arguably just as good or even slightly better than in THX, never exceeding 3.9. More significantly, the fixed gamma levels in the Cinema mode averaged 2.16, significantly closer to the desired 2.2 than the THX mode’s 2.04 average. For this reason, the calibrated Cinema mode was used for all 2D viewing.
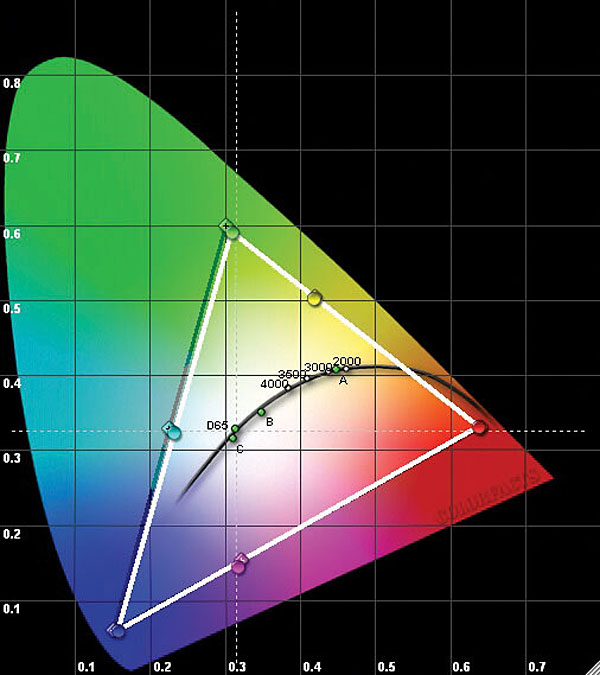
The 2D CIE chart shown above is for the TC-P55VT30. The other sets’ color gamuts were nearly identical and are shown in their respective lab reports. As discussed in the review, the TC-P55VT30 was calibrated for 3D in the Custom mode. This produced an excellent result (chart not shown) with calibrated Delta E values actually superior to those in 2D (thanks to the 10-step white balance adjustments in the Custom mode). The calibrated 3D Delta E values remained below 2.0 everywhere except 60 IRE, where the reading jumped to 2.39. With the 3D Custom mode’s gamma set to 2.0, the gamma measured an average of 1.61 from 20 IRE to 70 IRE, then dropped to 0.2 (that’s zero point 2) at 90 IRE. Surprisingly, some of the Custom mode’s gamma values, though technically inaccurate in any of the menu’s options, actually worked well with 3D material, with settings of either 2.0 or 2.2 producing the best results (the 3D, 2.6 setting measured an average of 2.1 up to 70 IRE but looked far too dim).—TJN
NEXT: Settings »
|
|
| ||||||||||
- Log in or register to post comments

Questioning the value rating...
Submitted by SunriseGatefield on August 7, 2011 - 10:45am
Great review Thomas, thanks.
I can't help but question the 4.5 star value score though... This review is substantially the same as for the ST30--save for a difference of .004 Ft-L (if I recall the values correctly) in the black levels (favoring the VT30, of course). I grant that the ST30 is a 5 star value. But is there enough evidence of the VT30's superiority here to make it nearly as good a value?
One other question: shouldn't the VT30's 96Hz refresh rate allow it to handle 24fps material better than the ST30? I didn't see mention of that in the review. Edit: My bad. Tom does mention the 96Hz refresh rate, and says he uses it for 24fps material. There's no mention here that the ST30 an GT30 lack this, but that's clear from the reviews of those models.


| Displays Electronics Speakers | Sources Other Gear Software | Top Picks of the Year Top Picks | Custom Install How To Buy How To Use |
Tech 101
|
Latest News Features Blogs | Resources Subscriptions |
WHERE TECHNOLOGY BECOMES ENTERTAINMENT
 © 2024 Sound&Vision
AVTech Media Americas Inc., USA
All rights reserved