- REVIEWS
Displays Electronics 
Speakers Sources Other Gear Software - HOW TO
How To Buy How To Use Tech 101
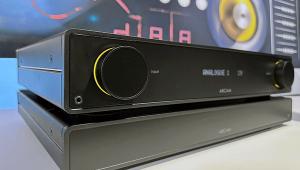
IE-33 Audio Analyzer Page 2
The display-resolution settings include 1 Octave, 1/3 Octave, 1/6 Octave, and Max Res, which maps the 240 horizontal pixels on the iPAQ screen to separate frequency bands. Above 200Hz, each pixel represents, at most, 1/24 of an octave.
 A couple of useful display options become available when Max Res is selected. One is LF Zoom, which uses the entire width of the display to draw the spectrum profile for only the low frequencies, up to 2kHz. The other option is Frequency Detect (see Fig.3), which identifies the frequency with the highest level at any moment. This is great for determining the frequency of any hums, buzzes, or other noises. By the time you read this, the IE-33 software will provide Frequency Detect at all display resolutions, not just Max Res.
At the far right of the control area is a window that displays various parameter values, depending on the selected function. In RTA mode, it displays the overall real-time level in user-selected units: dB SPL, dBV, dBu, and volts peak-to-peak and RMS. Also indicated is the selected weighting: A, C, or flat. Interestingly, the RTA display can be flat while the measurements are being taken with A or C weighting, which lets you see how the actual levels are affecting the weighted mea-surement. The SPL meter is a separate instrument with a broadband infinite impulse response (IIR) detector.
Below the resolution buttons is the Start/Stop button, which does as its name suggests. When you hit Stop, any frequency band can be selected, and its center frequency and level are displayed in the SPL window.
The middle column of onscreen buttons includes various controls. The Decay button changes the display's decay integration time, while the Weighting button lets you select A, C, or no weighting for the SPL measurements. The Speed button selects the response speed of the SPL meter: Fast, Slow, Impulse, or Peak.
Mem'ries
 Across the top of the control area are 12 small buttons that let you store and access snapshots of the incoming data. Scratch (temporary) memories are numbered 1 through 9; if you tap one of the numbered buttons, it turns blue and the spectrum profile at that moment appears on the screen. If you tap other memory buttons, the corresponding profiles appear in different colors (see Fig.4). The Memory button in the middle column of the control area calls up the memory screen, which lets you name, save, load, or clear any of the scratch memories, as well as other functions I'll get to shortly.
The Subtract/STC button brings up a screen that lets you select any two scratch memories and subtract one from the other. The resulting curve then appears in the main RTA screen. This is very powerful; for example, you could take nearfield and farfield measurements of pink noise from a speaker and subtract them to see the effect of the room. In my theater, those curves have similar shapes, offset by roughly 10dB in the midrange, 5dB in most of the high range, and 0dB in the bass and extreme high end (above 16kHz).
 Also in the Subtract/STC screen is a button labeled STC/NIC, which calculates transmission loss through a barrier by comparing two selected memories. (STC stands for sound transmission class, NIC for noise index class, terms used by acousticians to quantify transmission loss.) This is useful in determining the sound isolation between two rooms. The IE-33 subtracts one memory from the other and performs various calculations to derive an STC number, which is displayed in the SPL window. In the RTA display, a green curve indicates the difference between the two spectra, and a white curve indicates the weighting used in the calculations (see Fig.5).
In my house, the home theater is next to the master bedroom. To determine the STC value of the wall between them, I played pink noise through one speaker at reference level (0dB on the receiver), measured the spectrum—with flat weighting—at a location in the theater near the common wall, and stored it in one memory location. Next, with the pink noise continuing to play, I performed the same measurement in the bedroom at the corresponding location near the common wall, storing that measurement in another memory. Then, I selected the two memories and had the IE-33 calculate the STC value. I got a value of 31, which is normal for standard wall construction. With double studs and double drywall construction, it should be possible to get an STC value of 50 to 60.
Technically, the STC calculation should be performed on two averaged spectra, one averaged from several locations along the common wall in the room with the noise source, the other averaged from readings at the corresponding locations in the adjacent room. The IE-33 makes this easy with its averaging function, which I'll discuss in a moment. I didn't get appreciably different results with this method in my theater compared with taking a single reading on each side of the wall.
In the Subtract/STC window, you can also select the real-time input signal from which to subtract a memory and get a continuous STC display. This lets you take a snapshot of the pink noise in the theater, then move the mike around the other side of the common wall to find the spots (doorjambs, etc.) where leakage is greatest, and at which frequencies.
The IE-33 lets you define and store one or more preferred spectral profiles. Tapping the PT button sets the display resolution to 1/3 octave and lets you select any band and set its level with the up/down cursor buttons. In this way, you can "draw" any curve you want, then equalize to the drawn curve. This is a great feature, but it's cumbersome to do. Of course, once it's done, you don't have to do it again. Still, I wish you could establish a profile by simply drawing on the screen with the stylus.
Average Pink Noise
The buttons in the column next to the SPL window are associated with the process of averaging several spectra together. You can average measurements continuously, about four per second, or you can trigger individual measurements that are then averaged together. The curve representing the averaged spectrum is displayed on the RTA screen in blue, and it can be stored in any scratch memory.
Averaging facilitates some useful home theater applications. For example, you can play pink noise on the system, put the IE-33 in continuous averaging mode, and slowly walk around the room to get an average spectrum for the entire seating area. This normally requires several mikes in different locations, a microphone multiplexer (which outputs each mike's signal in rapid cyclic succession), and an RTA.
After taking an average spectrum of the seating area with the IE-33, you can pause the averaging (the RTA continues to function) and walk back through the seating area to find a spot where the real-time curve is as close as possible to the average curve. If you then place the EQ mike at that location, you'll be equalizing to the average response of the room.
|
| |||||||||
- Log in or register to post comments


| Displays Electronics Speakers | Sources Other Gear Software | Top Picks of the Year Top Picks | Custom Install How To Buy How To Use |
Tech 101
|
Latest News Features Blogs | Resources Subscriptions |
WHERE TECHNOLOGY BECOMES ENTERTAINMENT
 © 2024 Sound&Vision
AVTech Media Americas Inc., USA
All rights reserved